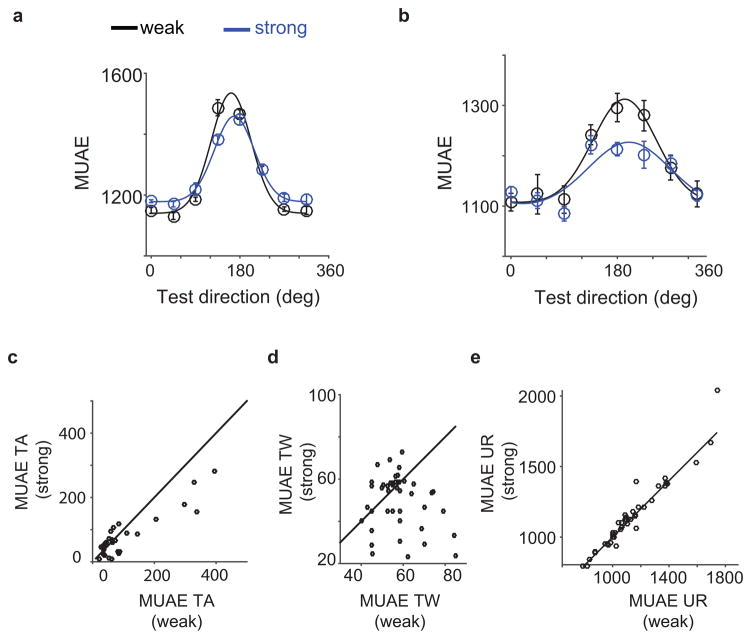
Figure 4.
Direction-selective adaptation induced changes in multiunit activity envelope (MUAE) tuning curve. (a) and (b) Strongly and weakly adapted tuning curves for two example sites. These two examples show a tuning peak decrease after adaptation. (c) Site-by-site comparison of TA. (d) Site-by-site comparison of TW. (d) Site-by-site comparison of UR. This figure shows that – although there are clear exceptions – the dominant/average effect of adaptation was to suppress MUAE tuning amplitude, and to make tuning widths narrower.

