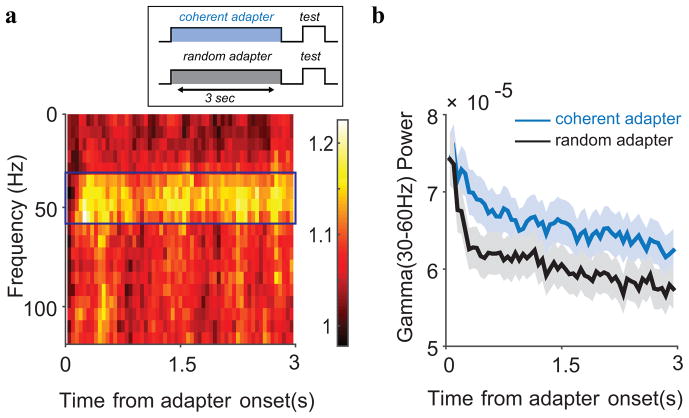
Figure 9.
Gamma band adaptation. (a) Ratio of the power following coherent and random motion (averaged across sites). A narrow band between 30 and 60 Hz showed a sustained, stronger response to coherent than to random motion patterns. (b) Gamma band power over time, averaged over all sites. Gamma band power was gradually suppressed over a period of seconds. On the time scale of seconds, the suppression (slope) did not depend on the stimulus or on the mean gamma band activity at that site.

