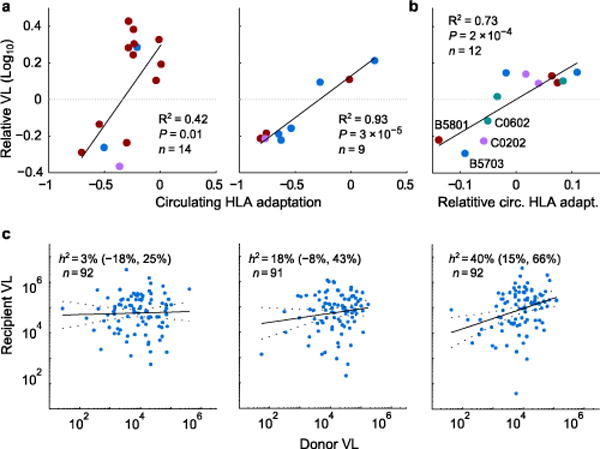
Figure 4. Adaptation impacts HLA-VL associations and heritability estimates.

(a) Circulating allele-specific adaptation is compared against allele-specific effects on VL, as estimated from a mixed model fitted to the Southern Africa (left; n = 2,298) or British Columbia (right; n = 1,048) cohorts. Alleles selected in an independent stepwise regression analysis are shown. P-values, pseudo-R2, from mixed model with random offsets for each locus. Blue, HLA-A; red, HLA-B, purple, HLA-C. (b) Four alleles showed city-specific VL effects (Durban, Lusaka, Gaborone). Their relative VL and circulating adaptation (mean centered for each allele) is shown. P-value, pseudo-R2, from mixed model with random offset for each city. See Supplementary Fig. 8. (c) Heritability (h2) estimates (95% CI) over all 275 Zambian linked transmission pairs with available VL and HLA types, stratified into tertiles by HLA-B adaptation-similarity (from left to right: low, medium, high). Donor and recipient VL adjusted for sex, age, and sample year independently for each stratum.
