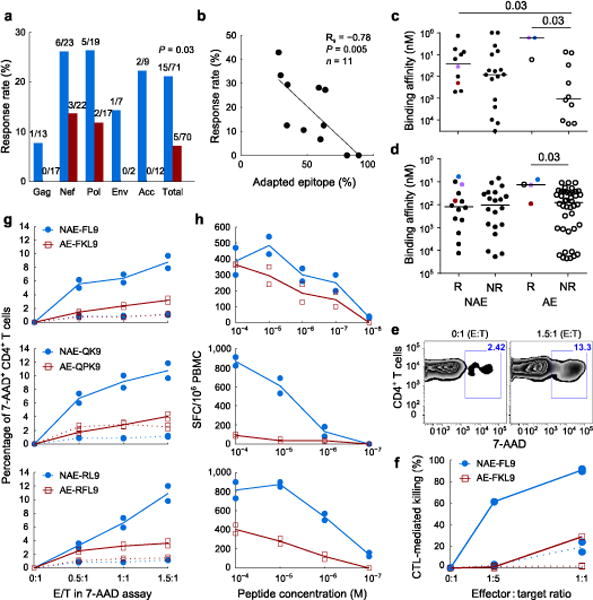
Figure 5. CTL responses against pre-adapted transmitted epitopes are dysfunctional.

(a, b) Interferon-γ response rates for autologous founder epitopes. (a) Response frequencies for non-adapted (blue) and adapted (red) epitopes. Number of epitopes tested and number of responses for each protein are indicated. P-value, Fisher’s exact test over total. (b) Response rate versus proportion of autologous epitopes that are adapted, on a per-subject level. (c, d) Experimental (c) and predicted (d) HLA-peptide binding affinity for adapted (AE) and non-adapted (NAE) epitopes that elicited response (R) or not (NR). Colored points represent matched immunogenic NAE/AE pairs. Solid bars, median; P-values, Mann-Whitney test. (e–h) Epitope-specific CD8+ T-cells (effectors) assessed for cytotoxicity of activated CD4+ T-cells (targets). All results from duplicate experiments shown. Lines, mean values; dotted lines, negative controls. (e) Representative flow cytometry plot for 7-AAD+ targets in the absence (0:1 E:T) or presence (1.5:1 E:T) of effectors. (f) Relative killing of targets from HLA-matched (solid) and mismatched (dotted) donors, infected with MJ4 virus mutated to contain the NAE or AE FL9 variant and incubated with NAE- or AE-specific effectors. (g, h) Cytoxicity (g) and antigen sensitivity (h) curves are indicated for the three matched NAE/AE epitopes pairs.
