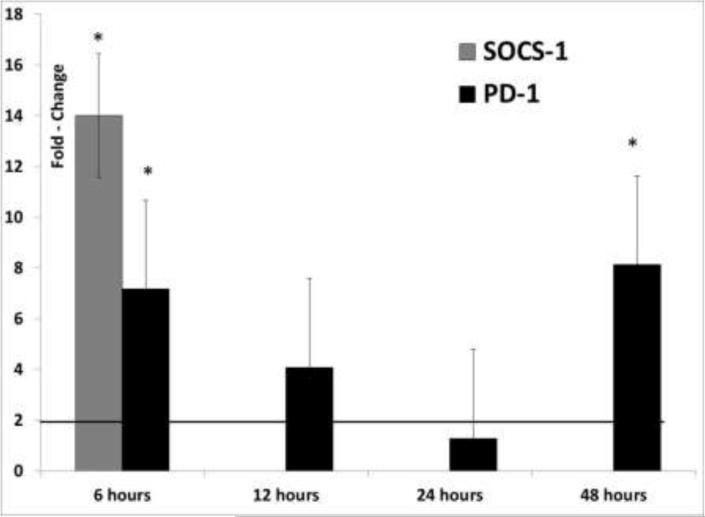
Fig 5.
Differential expression of immune regulatory genes: Fold change values for SOCS-1 and PD-1 (calculated by the ΔΔCt method) as the mean of four replicates of 3D4/31 swine macrophage cells, transfected with the TTSuV1 ORF1 protein at 6, 12, 24 and 48hrs are depicted. Fold change values ≥ 2 are considered significant (solid line). Insignificant values are not depicted. No significant changes were noted for cells transfected with the TTSuV1 ORF2 expression plasmid. * p ≤ 0.05.

