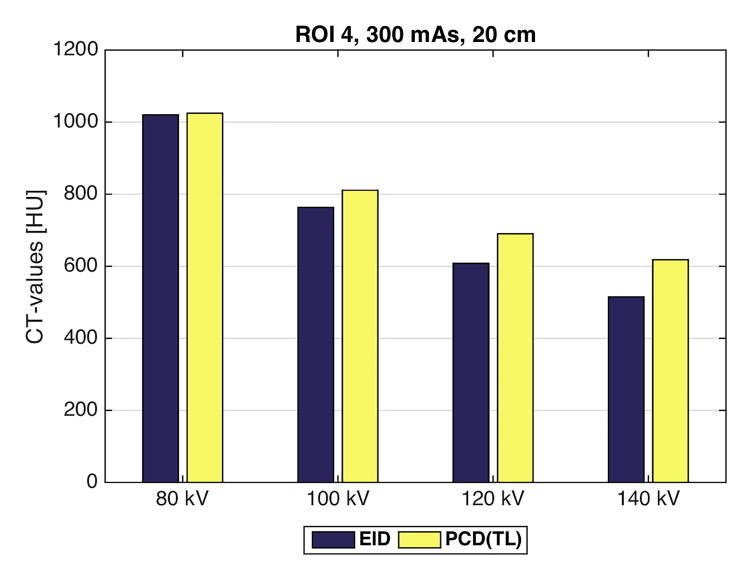
Figure 2.
Comparison of the CT numbers measured in region of interest 4 for the energy integrating detector (EID) and the low energy threshold (TL = 25 keV) image from the photon counting detector (PCD) for four tube potentials (80, 100, 120, 140 kV). At 80 kV, the iodine signal is nearly the same for the EID and PCD(TL) images. However, as the tube potential increases, the iodine signal in the PCD(TL) images is increasingly greater than the iodine signal in the EID images. Shown here are the CT-values for the 20 cm phantom at 80, 100, 120, or 140 kV and 300 mAs.

