Figure 4.
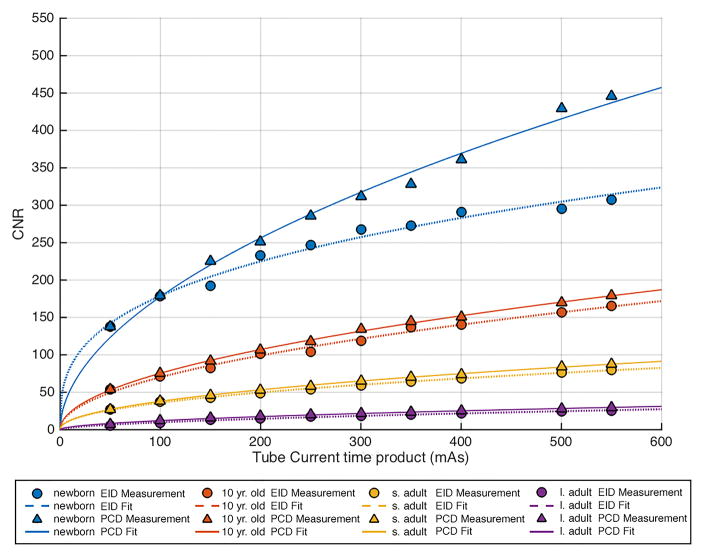
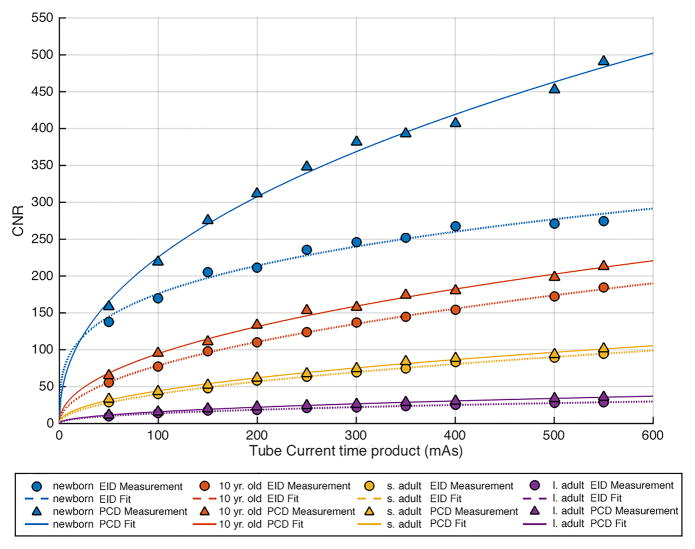
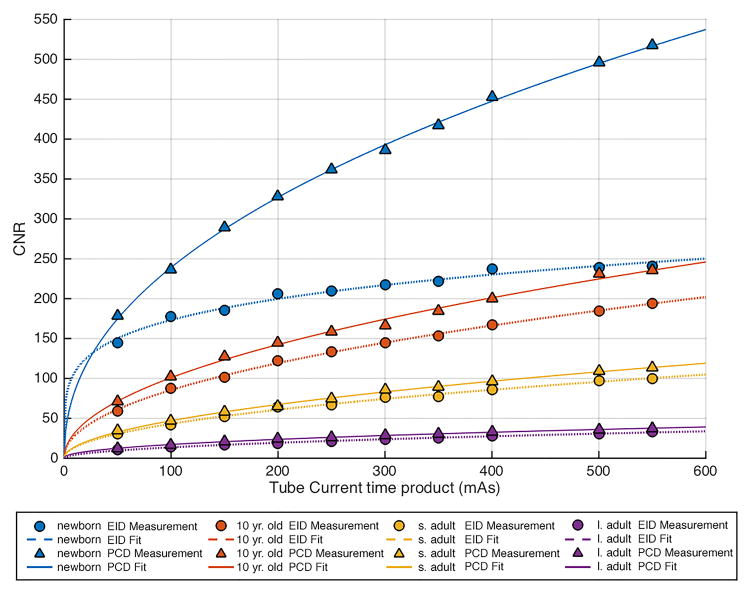
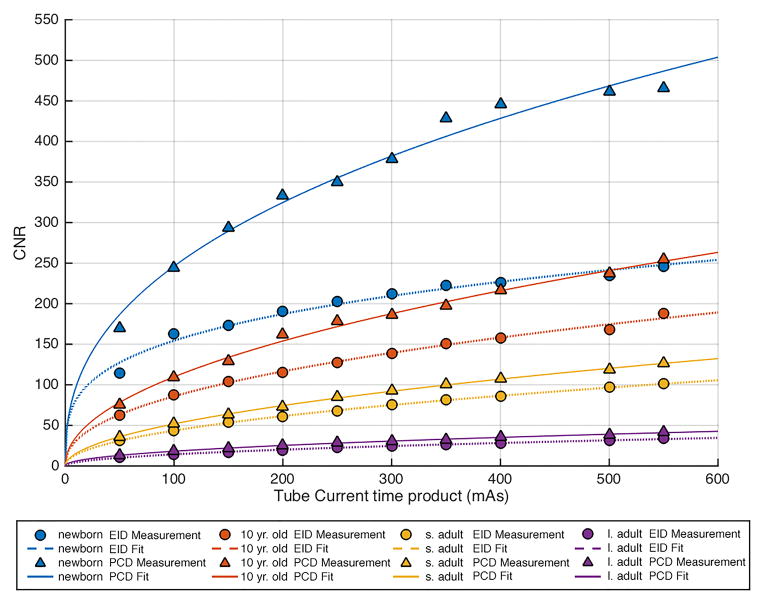
Comparison of contrast to noise ratio (CNR) versus tube-current-time-product (mAs) in each of the 4 phantom sizes between the energy integration detector (EID) images and the low energy threshold (TL) images from the photon counting detector (PCD). (a) 80 kV, (b) 100 kV, (c) 120 kV, (d) 140 kV. The iodine CNR in the PCD(TL) images was consistently greater than the iodine CNR in the EID images. s. adult = small adult, l. adult = large adult.


