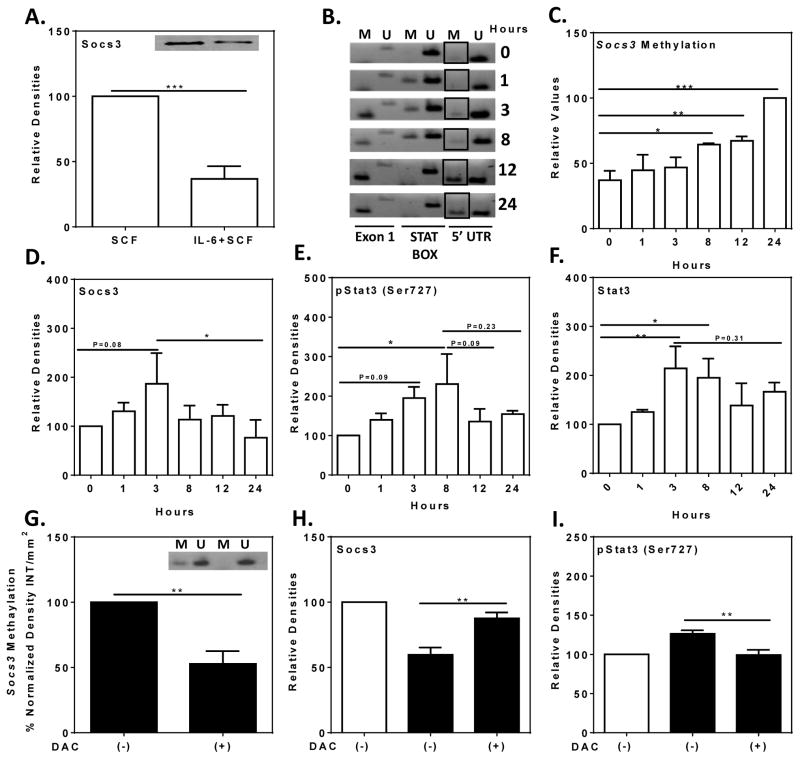
FIG 5. Effects of IL-6 on SOCS3, methylation of SOCS3 promoter, STAT3, and phosphorylated STAT3.
SCF-conditioned HuMCs were exposed to IL-6 (100 ng/ml) for the hours indicated or maintained in SCF and IL-6 continuously. (A) Representative immunoblot and densitometric data for levels of SOCS3 under both conditions (n=3). (B) Representative gel image obtained for methylation of the SOCS3 promoter of the 5′UTR domain (M and U indicate methylated and unmethylated domain specific primer sets) and (C) densitometric data from two donors. (D–F) Relative levels of SOCS3, STAT3, and phosphorylated STAT3 as determined by immunoblotting and densitometry (n=5). (G–I) Effect of 5-aza-2′-deoxycytidine (+/−DAC) pretreatment after addition of IL-6 (solid columns) or not (open columns). (G) A representative gel image (inset) and relative densitometric values (n=3) for SOCS3 promoter methylation (G) and relative densitometric values of immunoblots for SOCS3 (H, n=4) and phosphorylated STAT3 (I. n=5). Values are mean ± SEM of values. Significant differences: * P<0.05, ** P<0.01, *** P<0.001.

