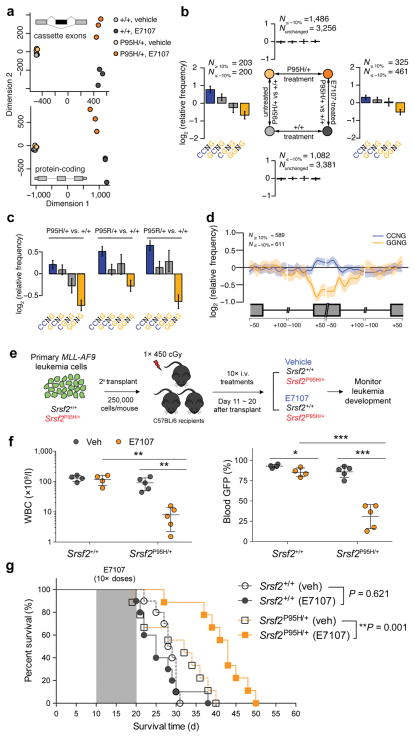
Figure 2. SRSF2-mutant myeloid leukemias are preferentially sensitive to pharmacologic modulation of splicing catalysis.
(a) Multidimensional scaling based on alternatively spliced cassette exons (top) and protein-coding genes (bottom) in BM lineage-negative Sca1− c-Kit+ (LK) cells from Mx1-Cre+Srsf2P95H/+ and Mx1-Cre+Srsf2+/+ mice treated with vehicle or E7107 (4 mg/kg) for 5 days (n = 3 mice per group). (b) Mean enrichment of all variants of the SSNG exonic splicing enhancer (ESE) motif in cassette exons that were differentially included versus excluded in a two-factor comparison across all 4 experimental groups. N≥10% and N≤ −10% indicate the numbers of exons that exhibited increases and decreases in inclusion, respectively, of absolute magnitude ≥10% for the illustrated comparisons. For each comparison, enrichment was computed by comparing the indicated sets of exons (e.g., N≥10% versus N≤−10% for the left- and right-hand comparisons). For sample comparisons where differentially spliced exons exhibiting increased inclusion were not present (top and bottom), cassette exons that exhibited differential splicing of absolute magnitude ≤10% were used as a background set to compute motif enrichment instead. The individual comparison used to generate each set of bar graphs is shown in the schema in the center of the figure. Error bars indicate 95% confidence intervals estimated by bootstrapping. (c) Mean enrichment of all variants of the SSNG ESE motif in individual SRSF2-mutant MLL-rearranged human AML samples relative to the median of 28 SRSF2-wildtype MLL-rearranged AML samples. Error bars indicate 95% confidence intervals estimated by bootstrapping. (d) Spatial distribution of CCNG and GGNG motifs along cassette exons included or excluded in the SRSF2P95H-mutant samples relative to the median wildtype control amongst MLL-rearranged AML samples. (e) Schematic of secondary transplantation experiments of mouse MLL-AF9 leukemias in Srsf2+/+ (Vav-Cre+Srsf2+/+) and Srsf2P95H/+ (Vav-Cre+Srsf2P95H/+) backgrounds to test the effects of E7107 in vivo. (f) WBC counts (left) and percentages of WBC cells expressing GFP (right) following 10 days of E7107 administration. (g) Kaplan-Meier survival curves of recipient mice treated with vehicle or E7107 (at 4 mg/kg) in Srsf2+/+ or Srsf2P95H/+ backgrounds. Shaded area represents period of vehicle or E7107 dosing. Error bars represent mean ± SD. *P < 0.05; **P < 0.005; ***P < 0.001.

