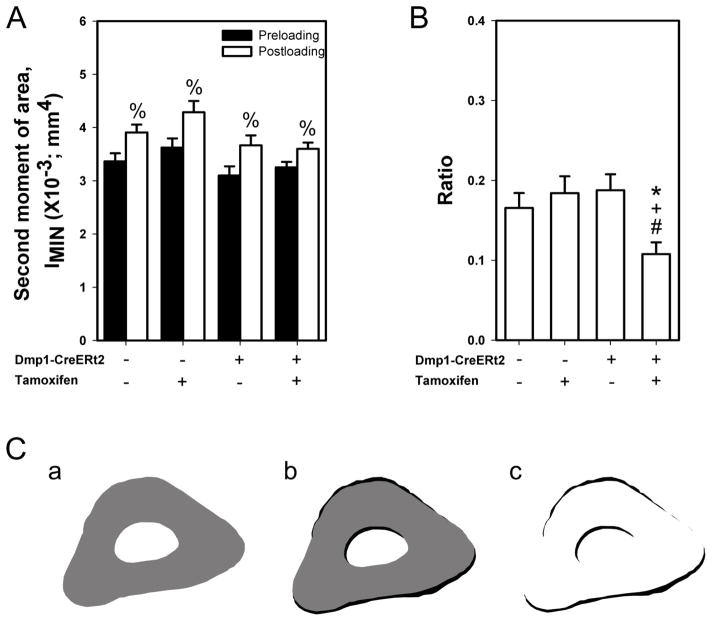
Fig. 4.
Cross-sectional moments of inertia were calculated from the loaded ulnar sections to quantify changes in ulnar adaptation to mechanical loading. (A) Second moment of area along the minor axis (IMIN) was calculated before loading (preloading; indicated by the calcein label) and after loading (postloading; indicated by the bone edge). % indicates p < 0.05 compared to preloading values. (B) The ratio of postloading to preloading second moment was significantly lower in the βcat recombined group compared to the remaining three groups (* p < 0.05 compared to CreERt2− with Oil group, + p < 0.05 compared to CreERt2− with tamoxifen group, # p < 0.05 compared to CreERt2+ with Oil group). (C) Representative ulnar images of (a) preloading (grey), (b) postloading (black), and (c) areal difference between preloading and postloading (black), showing typical geometric adaptation in a control mouse. Sample size for the second moment of area is n=10/group.

