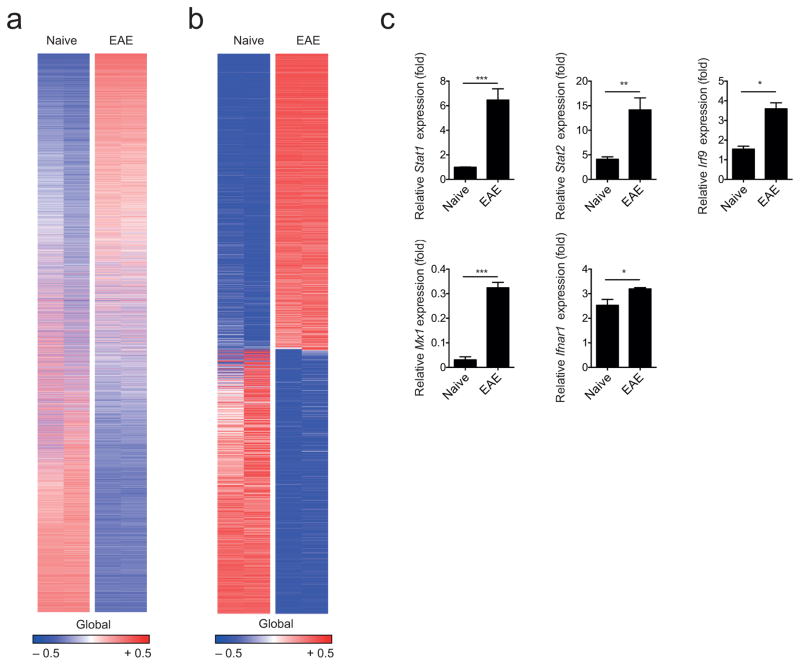
Figure 1. CNS inflammation induces a type I IFN signature in astrocytes.
(a) Heatmap of all 17,964 expressed genes (detected at level 0.1 in at least half of the samples) sorted by their differential expression (signal to noise ratio) between naive and EAE (peak disease) astrocytes; representatives out of two independent experiments (n = 2 per group). Gene expression levels are row centered and log2 transformed and saturated at − 0.5 and + 0.5 for visualization. (b) Heatmap of 1,869 differentially expressed genes sorted by their differential expression (signal to noise ratio) between naive and EAE (peak disease) astrocytes; representatives out of two independent experiments (n = 2 per group). Gene expression levels are row centered and log2 transformed and saturated at − 0.5 and + 0.5 for visualization. (c) qPCR analysis of transcription factors and relevant genes involved in type I IFN signaling from FACS-sorted naive and EAE astrocytes (n = 3; mean + SEM, Student’s t-test; normalized to Naive Stat1). Significance levels: *P < 0.05, **P < 0.01, ***P < 0.001, n.s.: not statistically significant.

