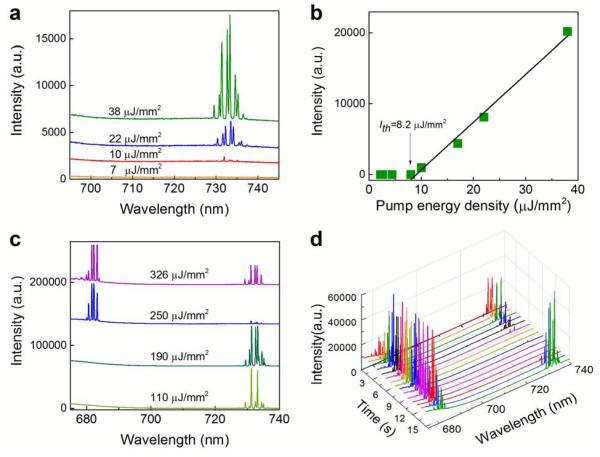
Figure 2.
(a) Lasing spectra of 0.1 mM Chla in ethanol with relatively low pump energy densities. Curves are vertically shifted for clarity. (b) Spectrally integrated laser output as a function of pump energy density extracted from the spectra in (a). The solid line is the linear fit above the lasing threshold, showing a laser threshold of ~8.2 μJ/mm2. Spectral integration takes place between 728 and 738 nm. (c) Lasing spectra of 0.1 mM Chla in ethanol with relatively high pump energy densities. Curves are vertically shifted for clarity. (d) Competition emission between two laser bands under a constant pump energy density of 326 μJ/mm2. Different colors represent the measured lasing spectra at different timing (seconds).

