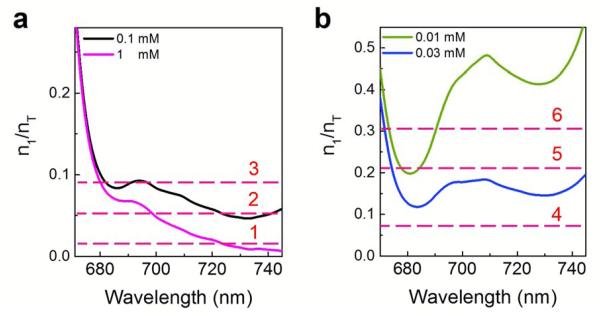
Figure 3.
(a) and (b) Fraction of Chla molecules in the excited states needed at the laser threshold for various representative Chla concentrations based on Eq. (2) with η=0.1 and Q0=107. Curves 1-6 corresponds to various excitation levels of Chla molecules. Curve 1: At a very low pump energy density, the Chla excitation is quite low. No laser emission is expected to emerge for 0.1 mM Chla. Curve 2: At an intermediate pump energy density, the lasing emission at the 730 nm band emerges for 0.1 mM Chla. Curve 3: At a relatively high pump energy density, both 680 nm and 730 nm bands emerge and compete with each other. Curve 4: At a low pump energy density, the Chla excitation is low. No laser emission is expected to emerge for either 0.03 mM or 0.01 mM Chla. Curve 5: At an intermediate pump energy density, two lasing bands are expected to appear around 680 nm and 730 nm for 0.03 mM Chla, and only one lasing band is expected to appear around 680 nm. Curve 6: With further increased pump energy density, the lasing emission increases in comparison with the case for Curve 5, but no laser emission is expected to appear at the 730 nm band for 0.01 mM Chla due to the requirement for extremely high Chla excitation.

