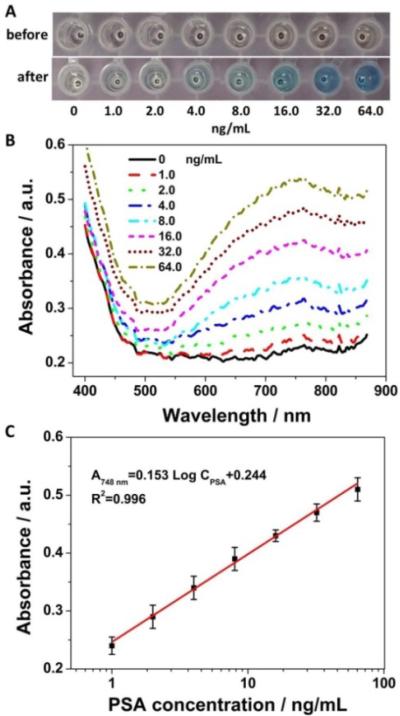
Fig. 4.
Photographs (A) and UV-Vis spectra (B) of the immunosensing solutions at different PSA concentrations (5% BSA) before and after the nanoparticle conversion process. (C) Calibration plot of absorbance at 748 nm in UV-Vis spectra vs. logarithm of the PSA concentration. Error bars indicate standard deviations (n=3).

