Figure 3.
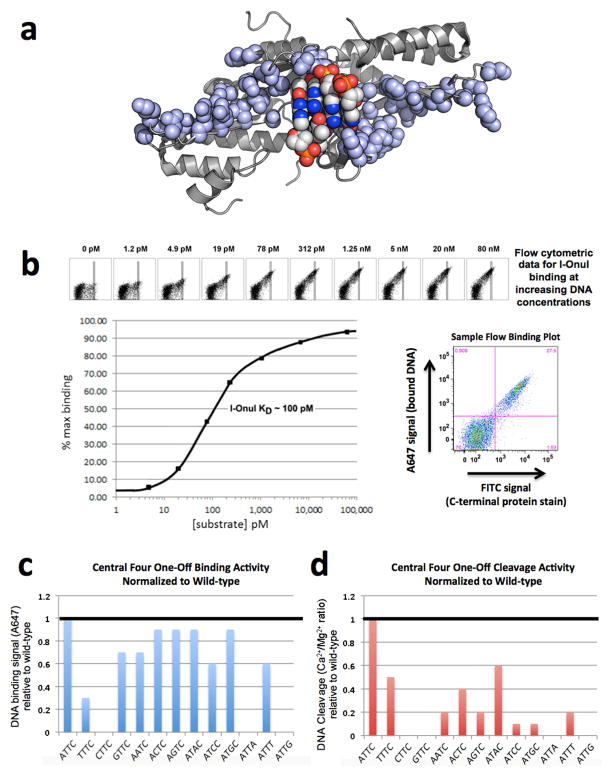
DNA binding and cleavage by the I-OnuI meganuclease. (A) The structure of the DNA-binding surface of the meganuclease. The atoms of all side chains involved in DNA contacts are shown as light blue spheres. The atoms of the central four DNA basepairs are shown as multi-colored spheres (with the major groove basepair edges pointing away from the enzyme, toward the reader). Note the lack of contacts to these basepairs. (B) Binding curve for I-OnuI to its wild-type DNA target, produced using the flow cytometric binding assay with surface-expressed I-OnuI combined with increasing concentrations of a fluorescently labeled DNA duplex harboring the wild-type target site. The raw flow cytometric data is shown with its corresponding DNA substrate concentration above the binding curve, with increasing concentrations of DNA substrate leading to increased binding signal (A647). The rectangular gates shown were used for quantifying the data. A sample flow binding plot illustrates the bound DNA signal (A647) on the y-axis and the C-terminal protein stain (FITC) on the x-axis. Experiments of this type were conducted for each enzyme with its wild-type target in order to determine a DNA concentration corresponding to the approximate KD of the interaction. This DNA concentration was then used for subsequent comparative analyses of binding to variant DNA targets harboring single basepair substitutions. (C) Relative binding of 12 DNA target site variants, each harboring a single basepair substitution in the ‘central four’ region of the target site. The wild-type target, which contains an ‘ATTC’ sequence in the ‘central four’ region, is shown at the left, and binding signal from the flow cytometric binding assay for all the variant targets are normalized to wildtype. (D) Relative cleavage of the same panel of DNA substrates, measured using the tethered cleavage assay. See FIgures S4 and S5 and the Supplemental Experimental Procedures for a description of the flow cytometric binding and cleavage assays and the Supplemental Data File S1 for the raw data used to produce these graphs.

