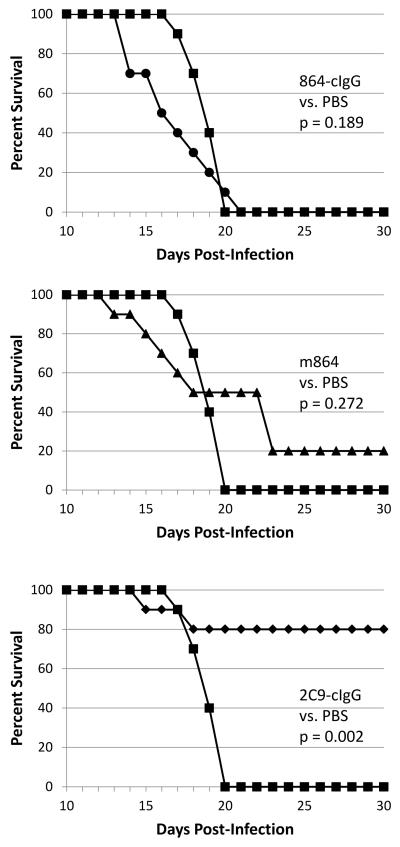
Figure 2.
Pairwise survival curves comparing MAb-treated, 17D-204 infected AG129 mice to PBS-treated, infected control mice. A log-rank test performed to compare the survival distributions between all treatments informed us that there is a significant difference between the treatments. The log-rank test performed for each pairwise comparison using a Bonferroni correction showed that only the 2C9-cIgG treatment is significantly different from the PBS-treated control. Top panel: 864-cIgG treatment compared to PBS, p =0.189; middle panel: m864 treatment compared to PBS, p = 0.272; bottom panel: 2C9-cIgG treatment compared to PBS, p = 0.002. Key: 864-cIgG (●); m864 (▲); 2C9-cIgG (◆); PBS (■). Ten mice were used per treatment.

