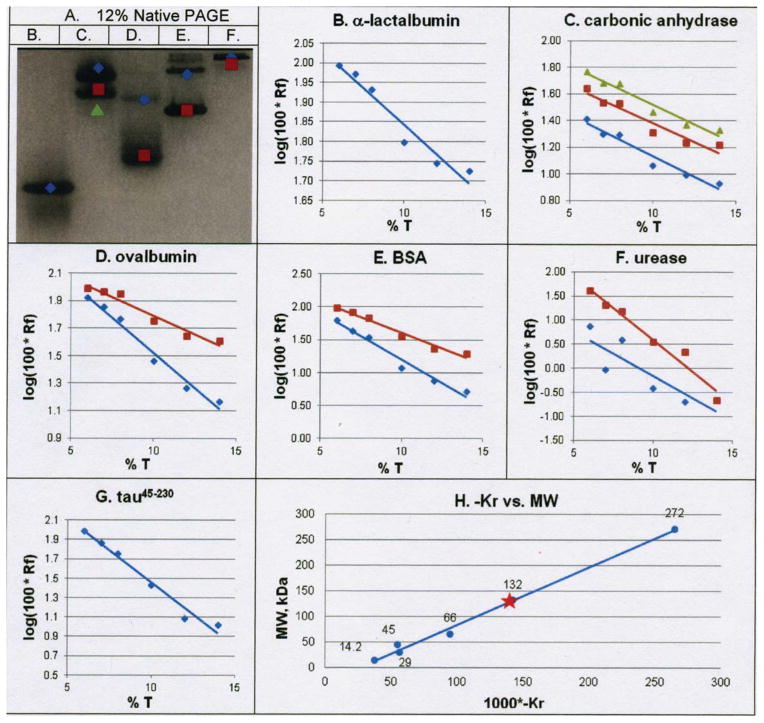
Figure 3.
Ferguson analyses demonstrate that tau45-230 assembles into heptamers/octamers under native conditions. (Panel A) Representative 12% native polyacrylamide gel analysis of 5 protein standards; oligomeric bands of standards are noted with colored shapes corresponding to plots in panels B–G. lane B, α-lactalbumin; lane C, carbonic anhydrase; lane D, ovalbumin; lane E, bovine serum albumin; lane F, urease. (Panels B–G) Rf vs T plots based on fractionation of all standards and tau45-230 on native gels of 6%, 7%, 8%, 10%, 12% and 14% polyacrylamide. (Panel H) KR versus molecular weight plot generated from the slopes (i.e., the KR) of the lines in panels B – G. Only data from lines with R2 values >0.9 in panels B–G were used to generate the plot in panel H; the blue plot in panel F was excluded based on poor fit to the line.

