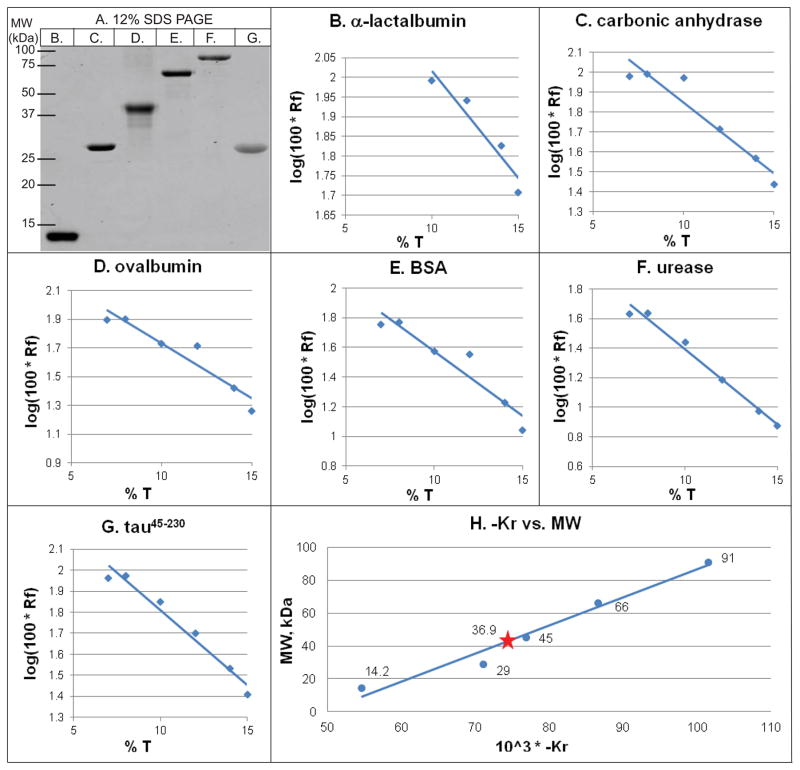
Figure 4.
Ferguson analyses demonstrate that tau45-230 assembles into dimers under SDS denaturing conditions. (Panel A) Representative 12% SDS/polyacrylamide gel of protein standards and tau45-230 used for Ferguson analyses. Lane B, α-lactalbumin; lane C, carbonic anhydrase; lane D, ovalbumin; lane E, bovine serum albumin; lane F, urease. (Panels B–G) Rf vs T plots based on fractionation of all standards and tau45-230 on SDS gels of 7%, 10%, 12%, 14% and 15% polyacrylamide. (Panel H) KR versus molecular weight plot generated from the slopes (i.e., the KR) of the lines in panels B – G.

