Figure 5.
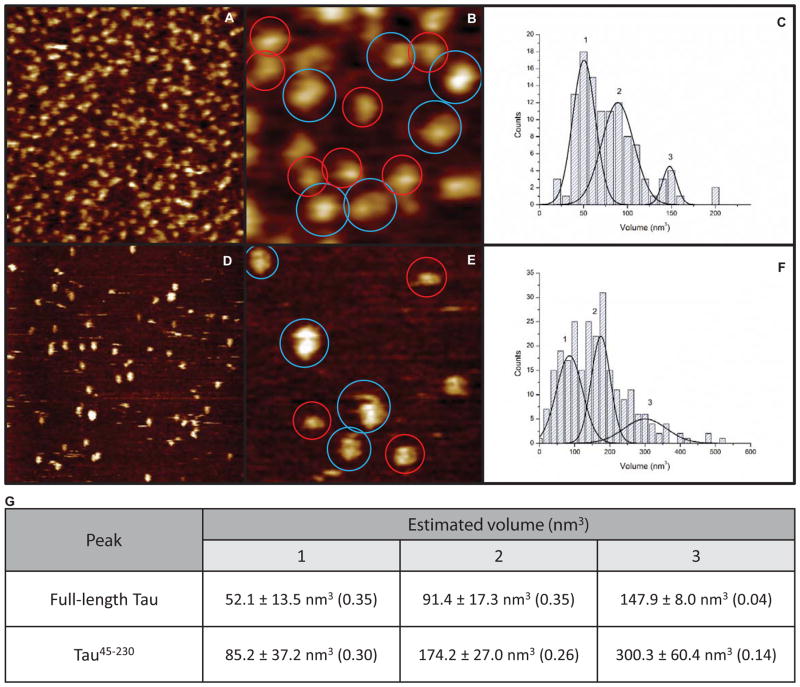
Atomic force microscopic imaging of 4R0N full-length tau (A, B) and tau45-230 (D, E) reveals both monomers and higher order oligomers. Volume estimations based on height data of full-length tau (scan sizes of A, B are 500 and 150 nm, respectively) reveal smaller structures (red circles) and larger structures (blue circles). (C) Volume histogram for full-length tau reveals structures of different size classes (n = 113). Similarly, AFM imaging of tau45-230 (scan sizes of D, E are 500 and 150 nm, respectively) reveals smaller structures (red circles) and larger structures (blue circles). (F) Volume histogram for tau45-230 reveals at least three different size classes (n = 251). (G) Table of volume measurements (in nm3) of the different size classes marked in panels C and F. The fraction of particles that fall within each size class is noted in parentheses. The remaining fraction (0.26 for full-length tau and 0.3 for tau45-230) fall outside of the range of the size populations described in (G) and could not be unambiguously classified to a specific cluster of sizes. See main text for a discussion of the different size classes.

