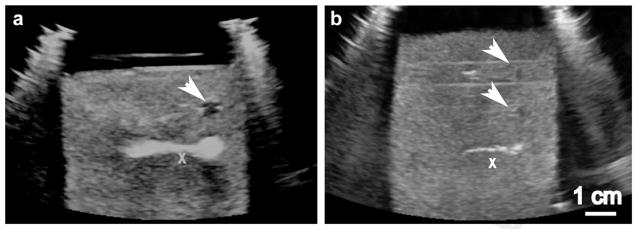
Fig. 2.
Ultrasound B-mode images of the hematoma phantom during treatment by (a) BH and (b) CH. The treatment pulses are incident from the right of the images. An “X” is positioned at the geometric focus of the transducer but off-axis, so as not to obscure the bubble activity. The images were taken at the end of a 20-s exposure; echogenic bubble clouds can be readily observed in both images. The white arrows indicate the hypoechogenic liquefied regions treated in previous exposures.

