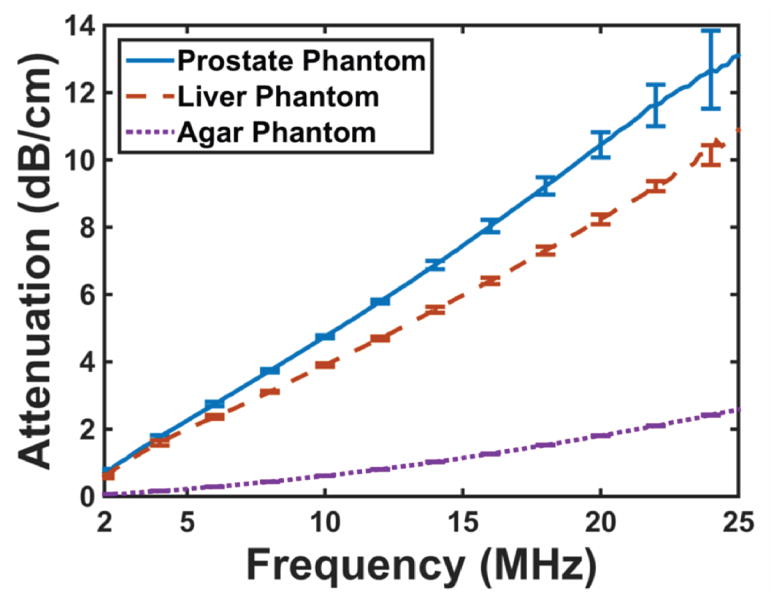
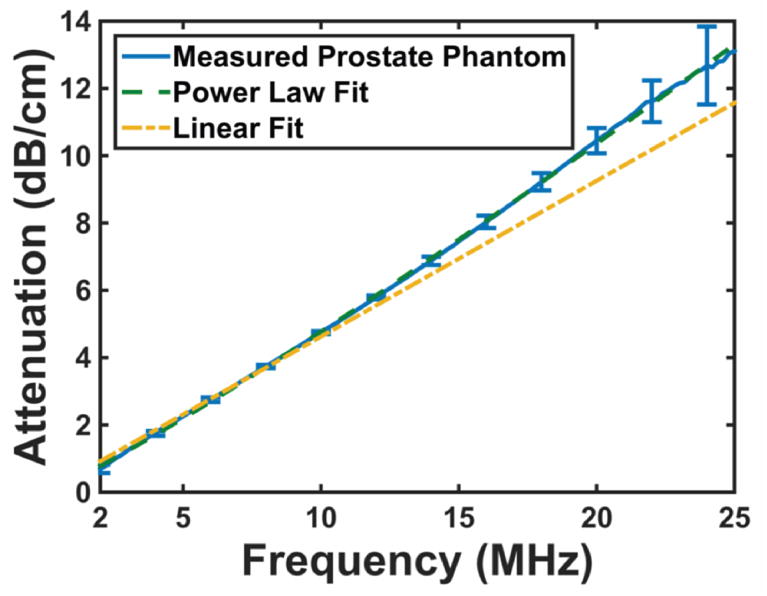
Figure 1.
(a) Attenuation spectra for each of the tissue phantoms between 2 and 25 MHz. The error bars are representative of the standard deviation (N = 3). (b) Measured attenuation spectra for prostate phantom (solid blue line), along with a power law fit (long dashed green line). The short dashed yellow line is a linear fit to the attenuation data between 2 and 10 MHz. Less than 3% difference is observed between the data and both fits below 10 MHz. The linear fit underestimates the measured attenuation for frequencies above 10 MHz.


