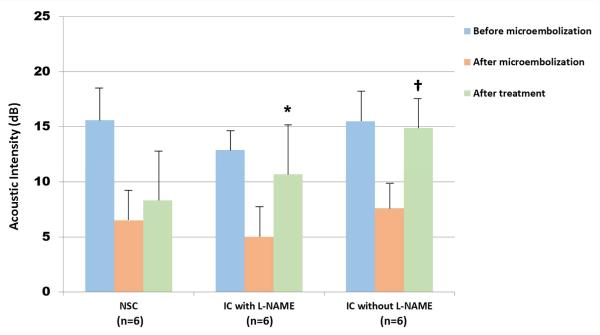
Figure 4. Effect of pretreatment with L-NAME on restoration of microvascular blood volume.
Skeletal muscle intensity bar graphs after microembolization. The skeletal muscle intensity following IC inducing impulses (green bar graphs) increased to nearly the same level as in the absence of L-NAME pretreatment (blue histograms). *<0.01 compared to before treatment; †<0.001 compared to before treatment. n = 6 for each group.

