Table 2.
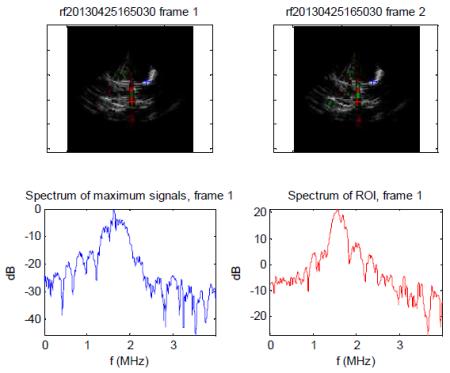
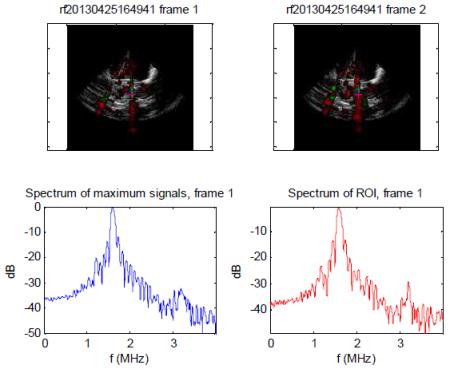
Root mean square (RMS) values for inertial cavitational activity recorded from the microvasculature by the passive cavitation detectors at the different therapeutic impulse settings. At the MI 1.6 setting, there was a significant increase in the magnitude of IC activity recorded by the PCDs which corresponded to the increased noise noted on the accompanying radiofrequency spectrum (lower display). At 0.8 MI (middle panel), there was a significantly less RMS voltage, and the returning radiofrequency display indicates sub and ultraharmonic indicative of dominant SC (middle image). The N values represent the number of times the particular setting was tested in the total of four rats examined. N=number of times the particular MI setting was tested
| Pulse Duration | MI 1.6 RMS (n=13) |
MI 0.8 RMS (n=14) |
MI 0.3 RMS (n=14) |
|---|---|---|---|
|
| |||
| 20 us | 4.051 ± 0.900 V | 1.028 ± 0.315 V | 0.083 ± 0.035 V |

|
| MI 0.8-Dominant SC inducing impulses (as indicated by the sub and ultra harmonic spikes on radiofrequency spectrum from two different regions of interest (red and blue) within the skeletal muscle preparation during a 10% Definity infusion. |

|
| MI 1.6 –Dominant IC radiofrequency spectrum observed from the same two regions of interest as indicated by absence of sub and ultraharmonic peaks and increased noise floor. Note the highest RMS value was for this setting, consistent with greater IC activity. |
