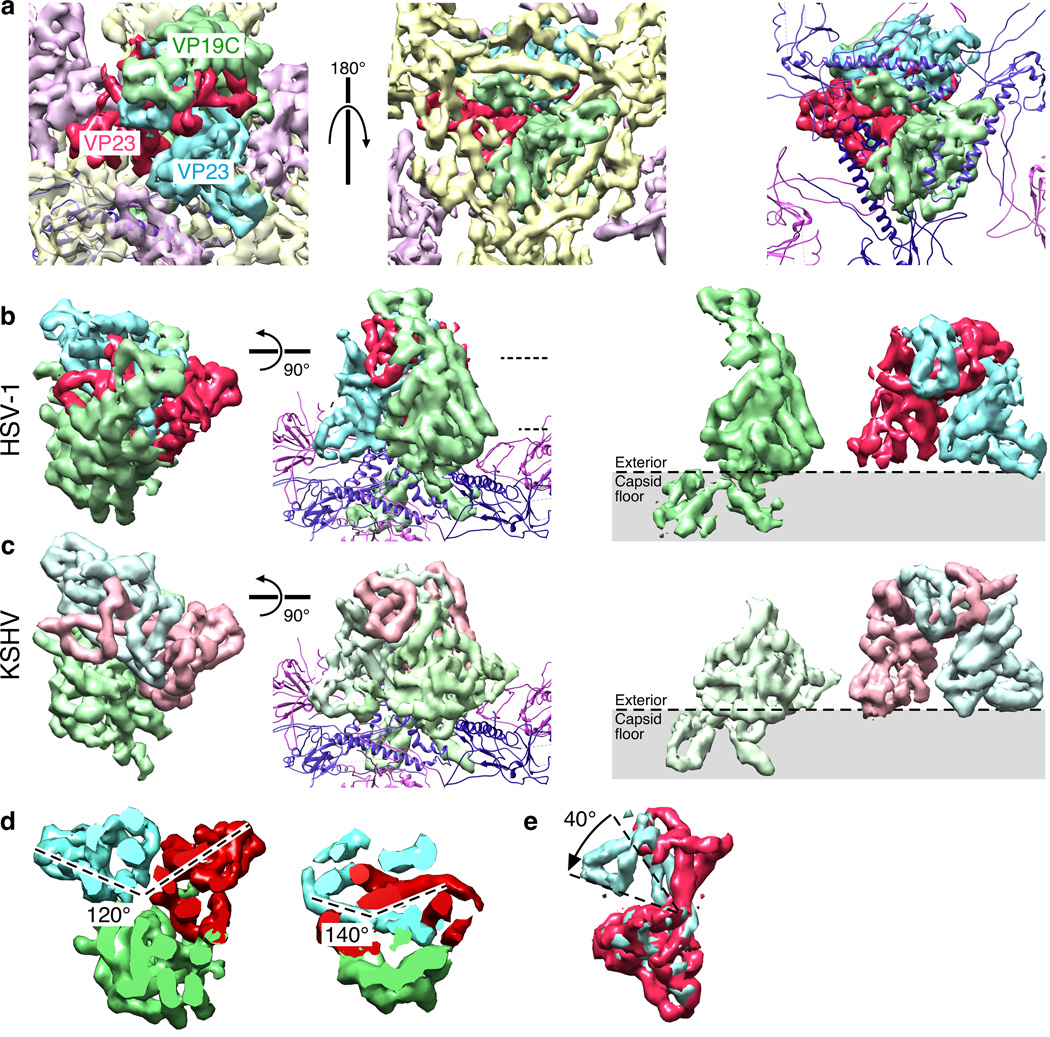
Figure 5. Triplex Organization.
(a) Views of the HSV-1 triplex density segmented into a dimeric region, corresponding to two copies of VP23 (red and blue), and an additional region corresponding to VP19C (green). At left, top view; center, bottom view of asymmetric density on the capsid interior surface assigned to VP19C; at right, bottom view with VP5 density replaced by the HK97-based model. (b) Top views of triplex density extracted from the HSV-1 map, and a side-view including models of the VP5 lower domain. At right, the VP19C monomer (green) and VP23 dimer (red and blue). (c) Views from a KSHV reconstruction (EMD 621449) corresponding to panel (b). (d) The rotational displacements between VP23 subunits at different heights, as indicated by dashed lines in panel (b). (e) Superposition of the two VP23 regions from one triplex.

