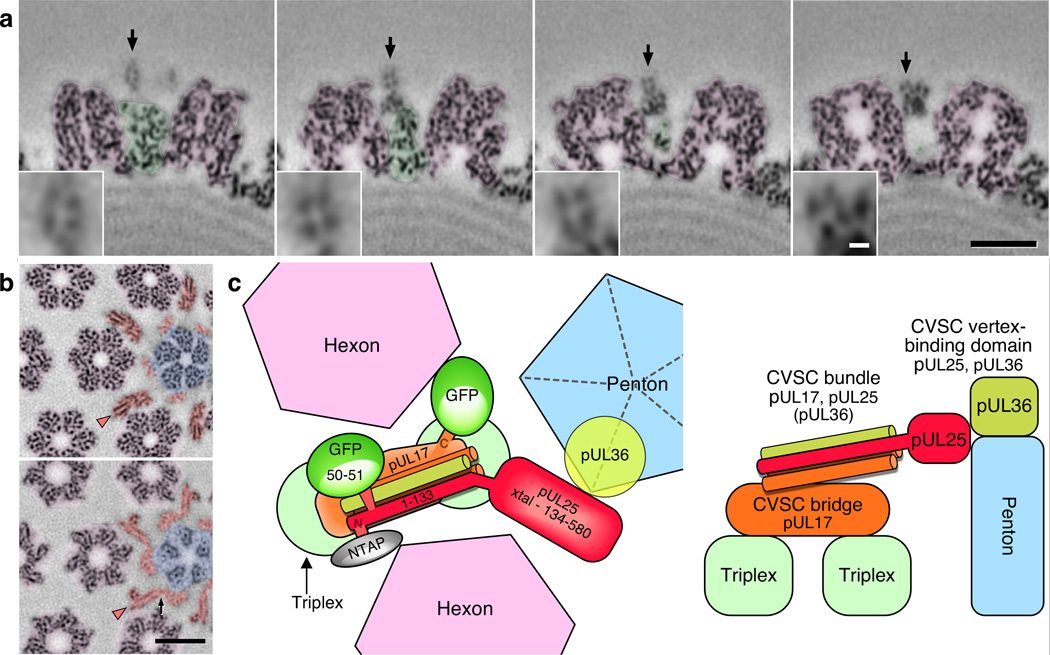
Figure 8. Organization of the CVSC molecule.
(a) Transverse sections through the CVSC helical bundle of PRV are shown at distances of 88Å, 99Å, 110Å and 121Å from the vertex, left to right respectively. Hexon density is colored purple and triplex density green. The arrows indicate the helical bundle, which is magnified 3-fold in the insets. Scale bars 100Å (black), and 10Å (white). (b) Radial sections slice the helices longitudinally (arrowheads). The top section is at lower radius, the bottom section at higher radius. Hexon density is purple, penton density blue, and CVSC density orange. Density connecting the pUL25 C-terminal and N-terminal domains is marked by a black arrow. Scale bar 100Å. (c) Model of the CVSC subunit organization, viewed from above (at left) and including the locations of two GFP tags and an N-terminal TAP tag previously reported,13,14,16 and from the side (at right).

