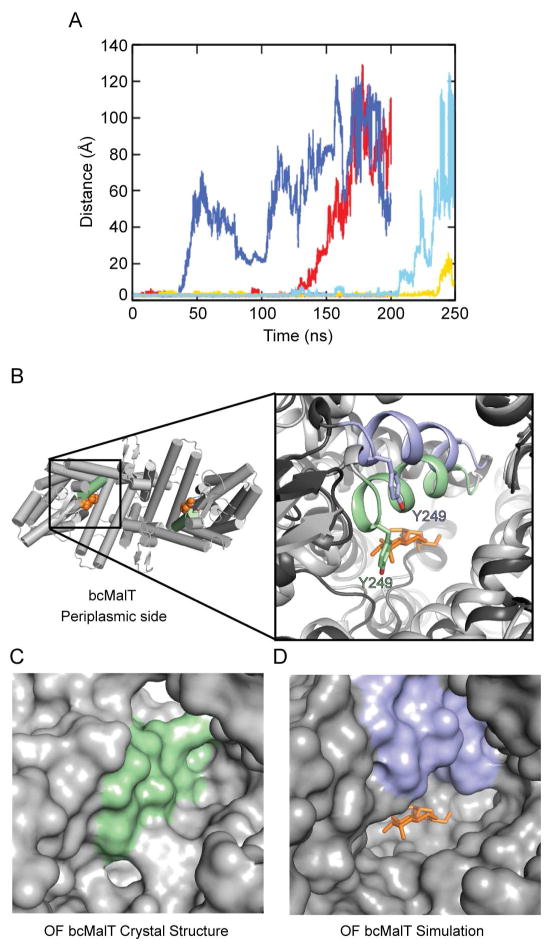
Figure 5. Dynamics of substrate release.
a. Substrate release during the course of the MD simulations, as indicated by the distance between Glu355 and the sugar. Traces are shown for a total of six protomers from two 200-ns simulations and one 250-ns simulation. b. The bcMalT crystal structure viewed from the periplasmic side. The bound maltose is shown in orange. Inset on left shows a close-up view of TM7 in the bcMalT crystal (green) and in a frame from an extended MD simulation showing release of the maltose (blue). The maltose molecule from the bcMalT crystal structure is shown as orange sticks. c–d. Surface representation of the bcMalT crystal structure (c) and the simulation model (d) shown from the same orientation. The maltose molecule from the crystal structure is shown as orange sticks.

