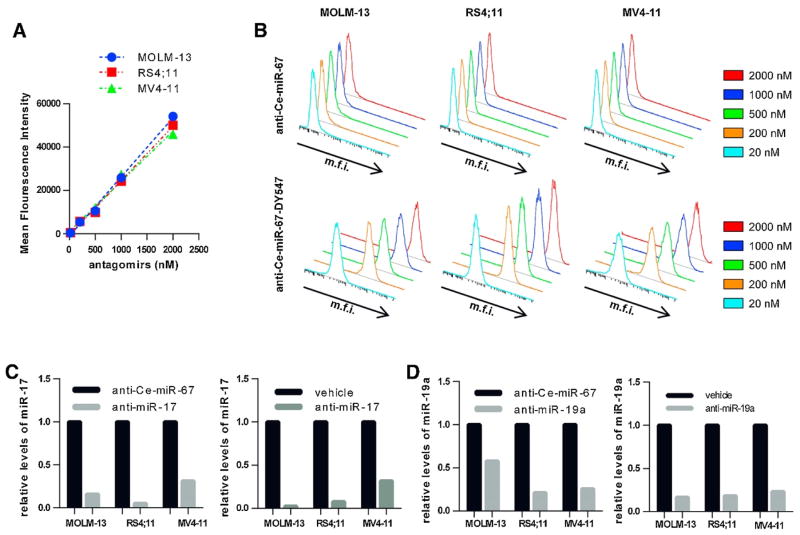
Figure 1. Antagomir treatment occurs in a dose dependent manner and results in a knockdown of target miRNA.
A–B) Antagomir uptake was determined by FACS analysis using a fluorescently labeled antagomir at multiple concentrations (20 nM–2000nM). A) Mean fluorescence intensity of cells was plotted at antagomir treatment concentrations of 20 nM, 200 nM, 500 nM, 1000 nM, and 2000 nM. B) Example plots of uptake for MOLM-13, RS4;11 and MV4-11 treated with increasing concentrations for a control antagomir (top) and its fluorescent-labelled counterpart (bottom). C–D) Antagomir-mediated knockdown of target miRNAs was verified at final treatment concentration in liquid culture. C) Knockdown shown for miR-17-5p levels relative to a control antagomir (left) or a vehicle control (right). D) Knockdown shown for miR-19a-3p levels relative to a control antagomir (left) or a vehicle control (right). Anti-Ce-miR-67 was used as a control to assess knockdown in all cell lines.

