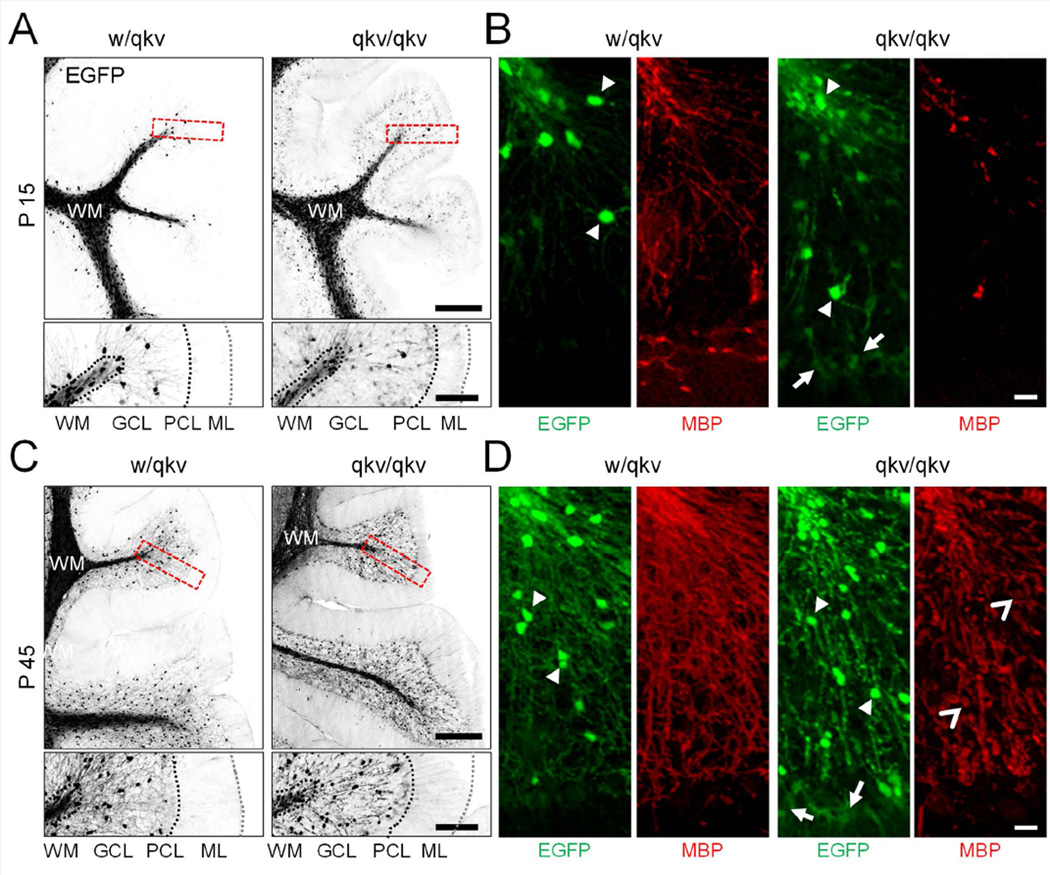
Figure 1.
PLP-EGFP+ cell distribution in the P15 and p45 cerebellum. (A,C) Top panels show representative images of sagittal cryosections from w/qkv and qkv/qkv littermates expressing PLP-EGFP at P15 and P45. Bottom panels are insets of boxed region from the end of single folium. (B,D) Images show EGFP+ cells (green) immunostained with anti-MBP (red) to detect myelin. Images represent maximum-intensity projections of at least 25 optical sections taken at 1 µm intervals stitched together. Arrowheads point to highly expressing EGFP+ cells, arrows point to weakly expressing EGFP+ cells, and open arrowheads point to fragmented regions of MBP staining. Scale bar (A,C) = 250 µm, insets = 100 µm; (B,D) = 20 µm.

