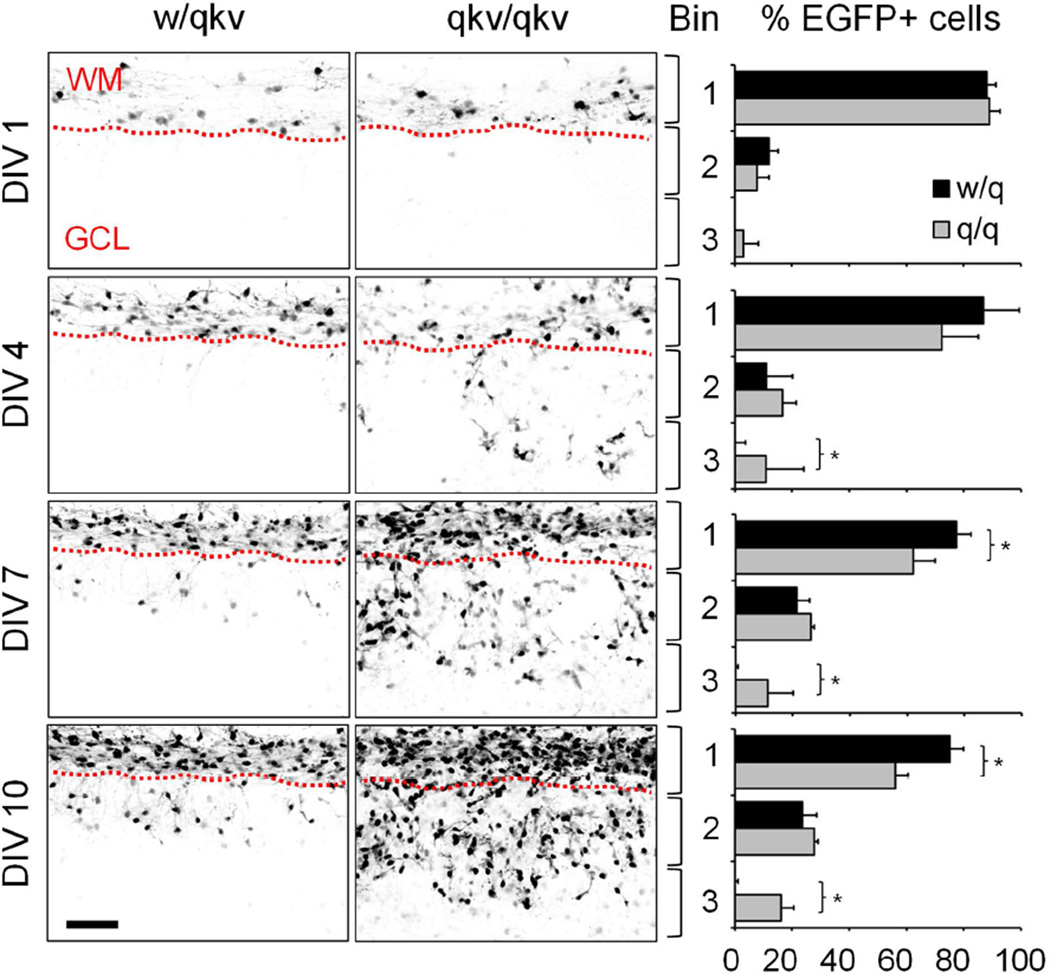
Figure 4.
Aberrant migration of oligodendroglia in qkv mice. Organotypic slice cultures were prepared from P7 heterozygous control (w/qkv) and quakingviable mutant (qkv/qkv) mice expressing PLP-EGFP. Images were acquired every 72 hours for 10 days, and represent maximum-intensity projections of at least 60 optical sections taken at 2 µm intervals. Histograms on right show the distribution of EGFP+ cells in each of three equivalent size bins expressed as a percentage of the total number of PLP-EGFP+ cells (n = 3 animals per genotype). Error bars: SD. *p<0.05 by Student’s t-test. Scale bar = 100 µm. WM=white matter, GCL=granule cell layer.

