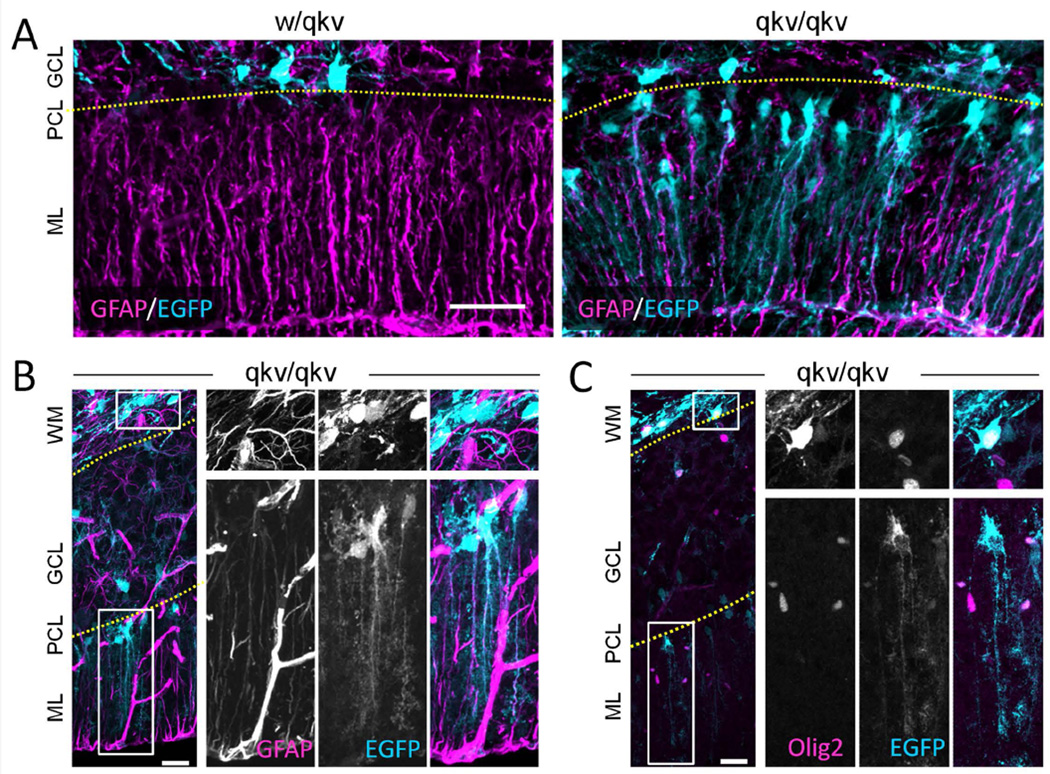
Figure 6.
PLP-EGFP+ cells in the Purkinje cell layer give rise to Bergmann glia in qkv/qkv mice. (A) Rrepresentative images of sagittal cerebellar section from P15 PLP-EGFP expressing (cyan) control w/qkv and qkv/qkv littermates stained with anti-GFAP antibody (magenta). (B–C) Representative panels show sagittal cerebellar sections from qkv/qkv mutant mice stained with anti-GFAP (B) or anti-Olig2 antibody (C), which are displayed in magenta whereas PLP-EGFP is shown in cyan. The boxed regions in WM and PCL are shown in 2X magnification on the right as individual channels (grayscale) and merged color image. The top panels on the right show the boxed region in WM of high PLP-GFP-expressing GFAP− cells (B) or high PLP-EGFP-expressing Olig2+ cells (C). The bottom panels on the right highlight the low PLP-EGFP-expressing GFAP+ cells (B) or low PLP-EGFP-expressing Olig2− cells (C) in PCL. Note that insets of low expressing EGFP+ cells were enhanced for visualization purposes. Scale bars (A) = 50 µm, (B–C) = 50 µm, insets = 12.5 µm. WM: white matter; GCL: granule cell layer; PCL: Purkinjie cell layer; ML: molecular layer. Yellow dotted lines indicate the layer separation.

