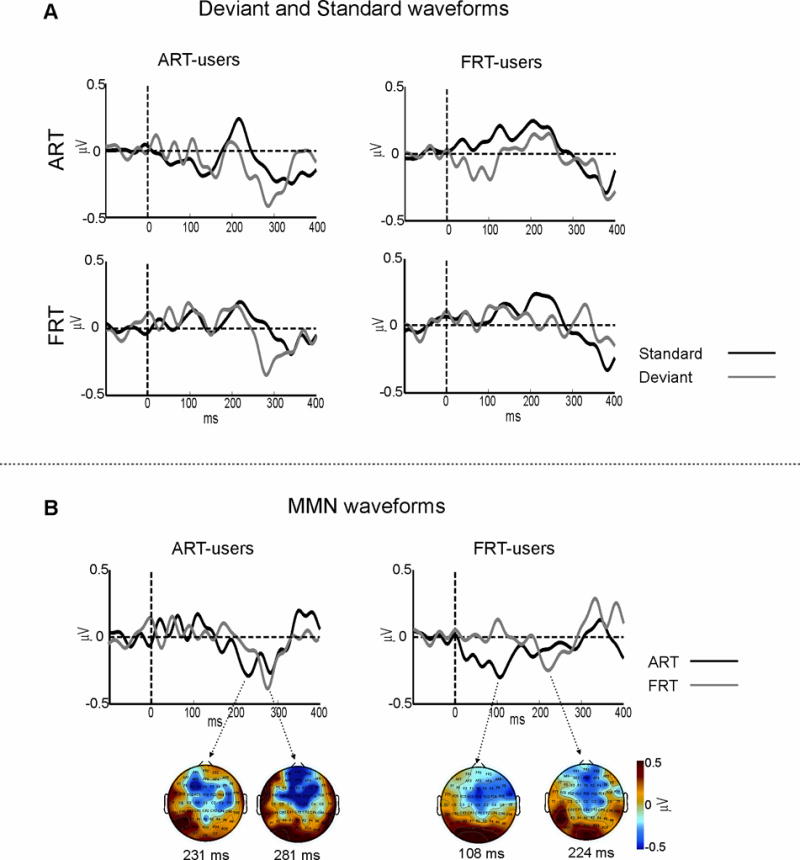
Figure 3.

A) Group average standard and deviant auditory evoked potential (AEP) waveforms for the ART-user group and FRT-user group to the spectral contrast (FRT) and the temporal (ART) contrast, collapsed across “flip-flop” conditions. B) Group average MMN waveforms (deviant – standard) for the ART-user group and FRT-user group to the spectral contrast (FRT) and the temporal (ART) contrasts. Topographic plot of the group average MMN peaks with corresponding time points are shown in below the MMN waveforms.
