
Figure 1.
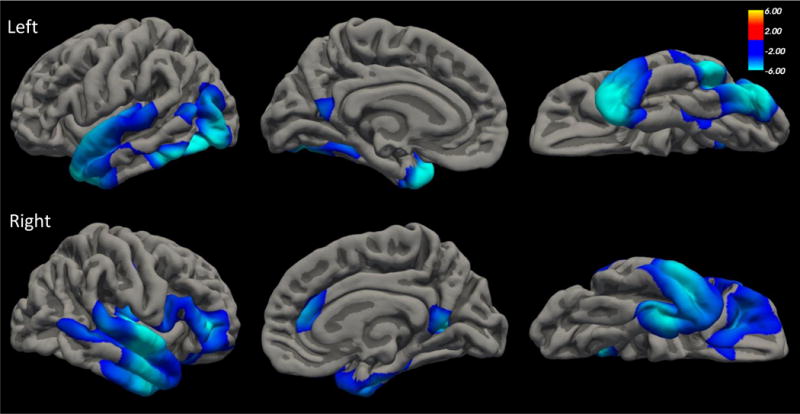
The top and bottom panels show the regions of the left and right cortices, respectively, that were whole-brain associated with MetS factors scores, controlling for age and sex. The figures show lateral (left), medial (middle), and ventral (right) slices.