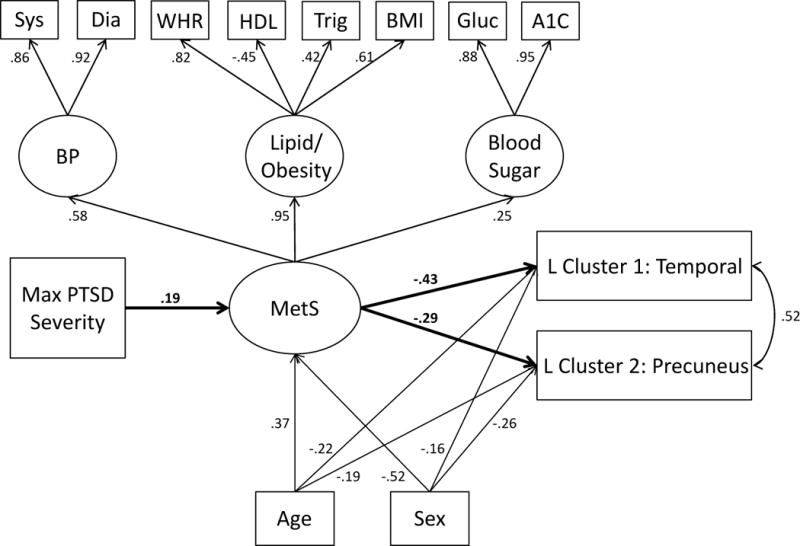
Figure 2.

The Figure shows the higher-order measurement model (confirmatory factor analysis) of MetS and the structural associations between maximum PTSD severity, MetS severity, and the left hemisphere cortical thickness clusters that emerged in the whole-brain analyses. Latent variables are denoted by circles and observed indicators by squares. The primary structural paths of interest are bolded for clarity. All lower- and higher-order factor loadings were significant at the p < .001 level. The primary paths of interest were significant at the p < .001 level except for MetS→ Cluster 2 where p = .001. For covariates, age and sex were significantly associated with MetS (p < .001) and with cluster 1 (ps =.004 and .02, respectively) and cluster 2 (ps = .004 and < .001, respectively). PTSD = posttraumatic stress disorder; MetS =metabolic syndrome; sys = systolic; dia = diastolic; WHR = waist-hip-ratio; HDL = high density lipoprotein; trig = triglyceride; BMI = body mass index; gluc = glucose; BP = blood pressure; L = left.
