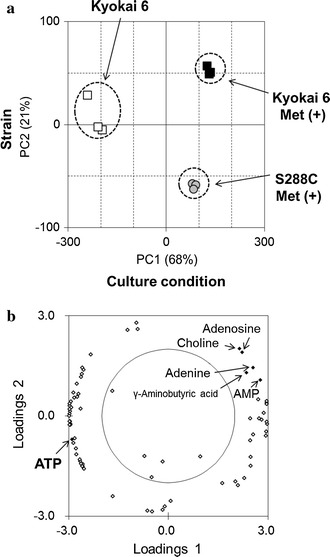
Fig. 3.

Score and factor loading plot of PCA in metabolome data. a PCA score plot of PC1 and PC2. White squares Kyokai 6 without l-methionine; black squares Kyokai 6 with l-methionine; gray circles S288C with l-methionine. b Factor loading plot for PC1 and PC2
