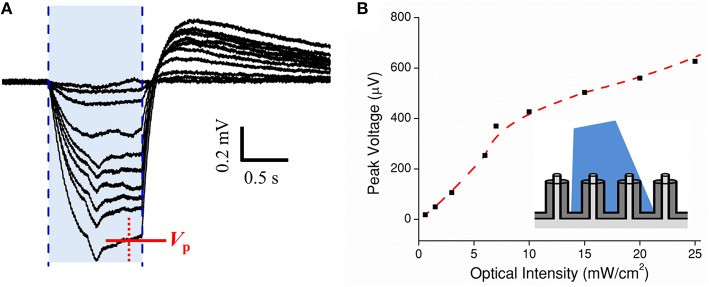
Figure 5.
Dose test of optogenetic HEK-ChR2 cells cultured onto a cMEA. (A) Dose test during top side illumination (473 nm) of HEK-ChR2 cells cultured onto a cMEA. The shaded blue region indicates the light-on times and the red arrow indicates the time at which peak voltage was determined (signal having reached a local steady state). (B) Peak voltage as a function of power density with parametrically fitted line to guide the eye. Inset depicts light-from-above configuration.

