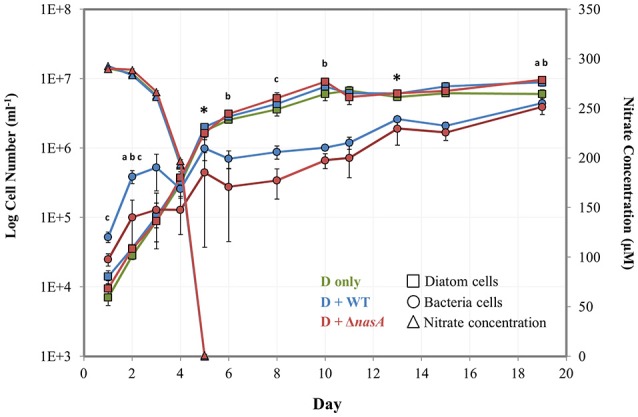
Figure 1.

Log number of bacteria and diatom cells (left vertical axis) determined by flow cytometry and nitrate concentrations (right vertical axis) determined by spectrophotometry during the baseline experiment. Squares = diatom cell numbers, circles = bacterial cell numbers, and triangles = nitrate concentrations (μM). Green markers = P. tricornutum monocultures (also noted as D only), blue markers = P. tricornutum–A. macleodii WT co-cultures (also noted as D + WT), and red markers = P. tricornutum–A. macleodii ΔnasA co-cultures (also noted as D + ΔnasA). Exponential growth stage was defined as days 1–6, and stationary growth phase as days 7–19. * indicates the two sampling points for physiology and transcriptomics. a indicates that diatom cell numbers were significantly different between P. tricornutum monocultures and A. macleodii WT co-cultures. b indicates that diatom cell numbers were significantly different between P. tricornutum monocultures and A. macleodii ΔnasA co-cultures. c indicates that bacteria cell numbers were significantly different between the WT and ΔnasA co-cultures. All data points represent the average of n = 3 replicates, and error bars are standard deviation. Some differences in cell numbers and nitrate concentrations (e.g., diatom monoculture nitrate concentrations, which are overlapped by the ΔnasA co-culture measurements) are difficult to discern, so average non-transformed cell numbers and nitrate concentrations have been listed in Supplementary Table 2.
