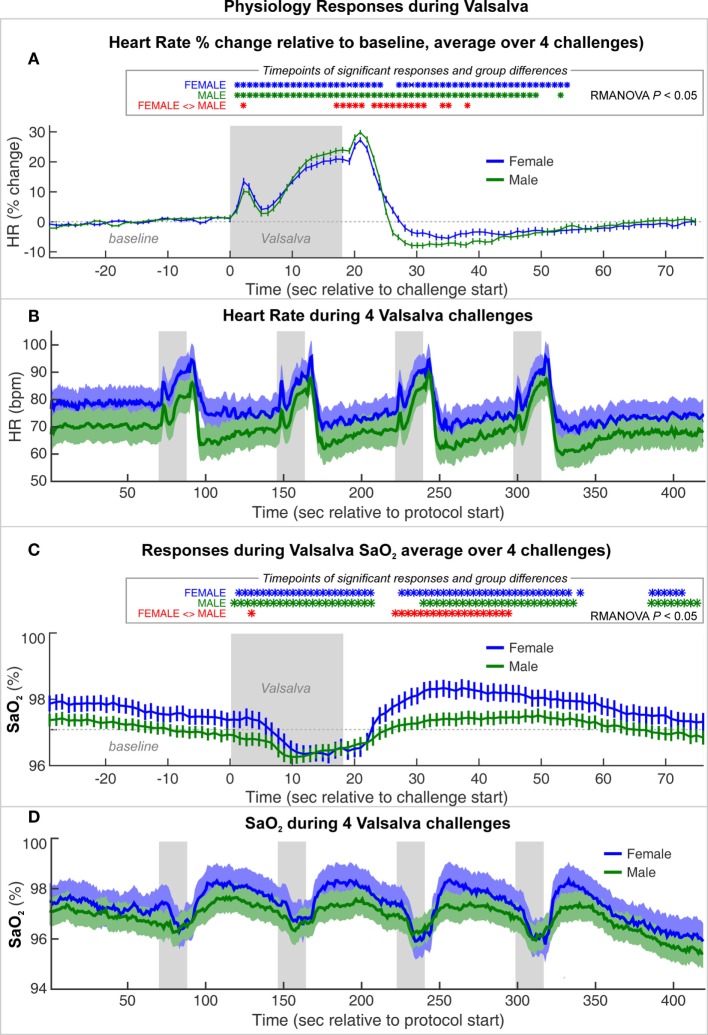
Figure 2.
Heart rate (HR) and SaO2 changes during a series of four Valsalva maneuvers, averaged for female and male groups. (A) HR% change relative to baseline and (C) SaO2 averaged over four challenges (mean ± SE). Timepoints of significant within-group responses indicated in blue and green *, and significant group differences in red, based on P < 0.05 with repeated measures ANOVA (RMANOVA). (B) Absolute heart rate and (D) SaO2 over series of four Valsalva maneuvers, averaged over females and males with SE shaded.

