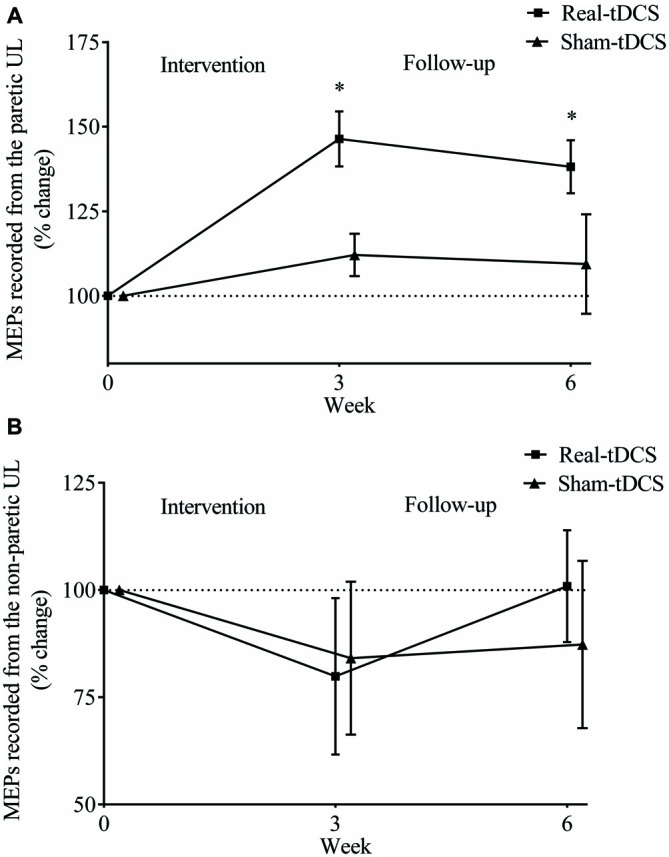
Figure 5.

Mean (± SEM) log motor evoked potential (MEP) amplitudes recorded from the paretic (A) and non-paretic UL (B). Results are displayed for post intervention (week 3) and follow-up (week 6) as percentage changes from baseline (week 0). *P < 0.05 within-group change relative to baseline.
