Figure 6.

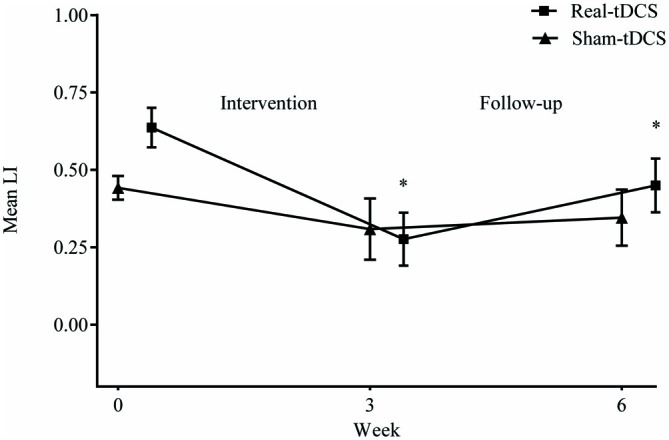
Mean (±SEM) raw values for laterality index (LI) at baseline (week 0), post intervention (week 3) and follow-up (week 6). *P < 0.05 within-group relative to baseline.

Mean (±SEM) raw values for laterality index (LI) at baseline (week 0), post intervention (week 3) and follow-up (week 6). *P < 0.05 within-group relative to baseline.