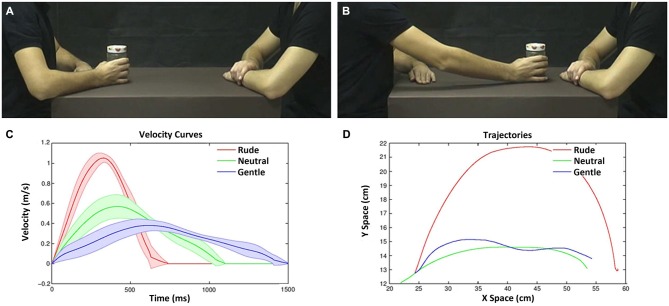
Figure 2.
Example of video-clips as viewed by the participants in the experiment (A,B) and their physical properties (C,D). Frame representing an action with the object in the start position (A); frame representing the same action in the end position (B). Velocity and trajectory profiles of the actions performed by the male actor (move a bottle, can and jam) with three vitality forms. Graph depicts the velocity profiles (Y axis) and duration (X axis) (C). Graph depicts the action trajectories (gentle, blue line; neutral, green line; rude, red line; D).The variance among objects is represented by the lines boundary.

