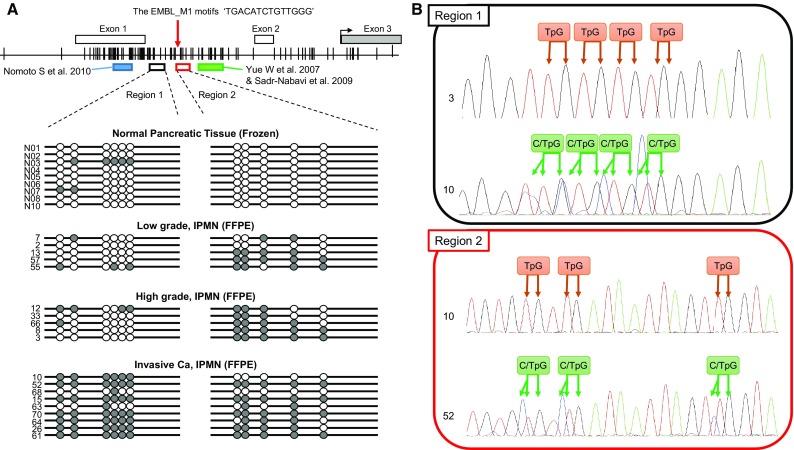
Fig. 1.

Bisulfite sequencing of the discrete EFEMP1 gene promoter regions. a Schematic representation of the location of discrete EFEMP1 gene promoter regions and the result of bisulfite sequencing. The white and gray boxes denote untranslated and translated exon in the EFEMP1 gene, respectively. The red allow indicates the location of the EMBL_M1 motifs ‘TGACATCTGTTGGG’, a candidate of CTCF biding site. The black arrow indicates the transcriptional starting site. The blue box indicates the regions of which methylation status was analyzed by Nomoto et al. (2010). The green box indicates the regions of which methylation status was analyzed by Yue et al. (2007) and Sadr-Nabavi et al. (2009). Vertical lines indicate CpG sites; white circles represent unmethylated CpGs; and gray circles represent methylated and unmethylated CpGs observed by bisulfite direct sequencing. b Examples of bisulfite sequencing in region 1 and 2. Each CpG was categorized as unmethylated or methylated CpG. TpG denotes the CpG site consisting of unmethylated CpG only. C/TpG denotes the CpG site consisting of both methylated (CpG) and unmethylated CpGs (TpG)
