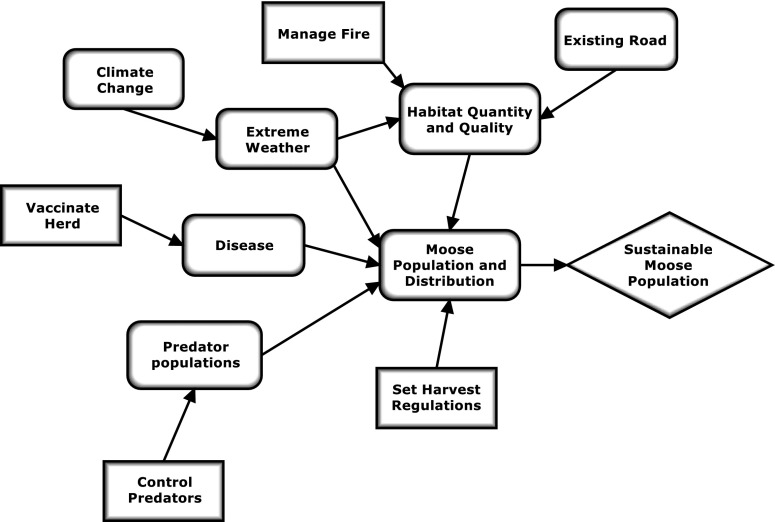
Fig. 3.
The influence diagram, developed in step 3, is a conceptual model that illustrates the “big picture” associated with a problem and indicates where decisions or actions could be applied and their assumed pathways of influence. This diagram depicts factors and actions that can potentially affect the fundamental objective (diamond) of sustaining the moose population in the example. Contributing factors (rounded rectangles) include things that may respond to management actions (habitat quantity and quality, disease, predator populations) as well as factors that are largely outside the manager’s control (extreme weather). Rectangles denote potential management actions

