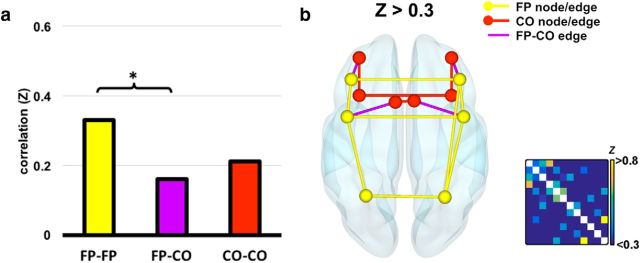
Figure 3.
Functional connectivity of residual activity between MD ROIs. a, Mean connectivity within each subnetwork and between the two subnetworks. Significant differences at the level p < 0.05 are shown. b, Graph resulting from a threshold of Z > 0.3. For conventions, see Figure 2.

