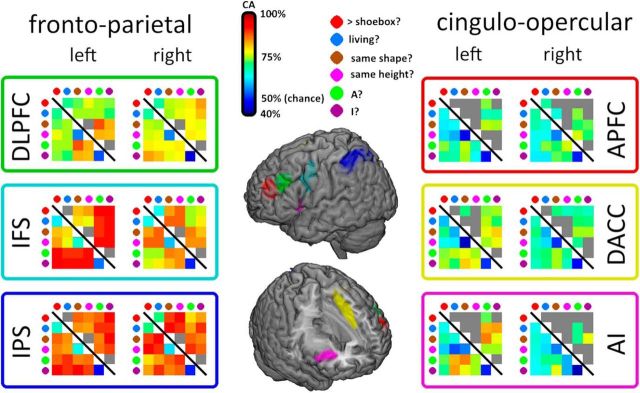
Figure 4.
Task decoding across the multiple demand ROIs. The MD ROIs are shown on the central brain rendering. Results for FP ROIs are shown on the left and those for CO ROIs on the right. Within each ROI, each colored matrix shows mean CA for all task pairs averaged across participants. The bottom left of each matrix shows all CAs; the top right shows the same CAs but with nonsignificant CAs greyed out.

