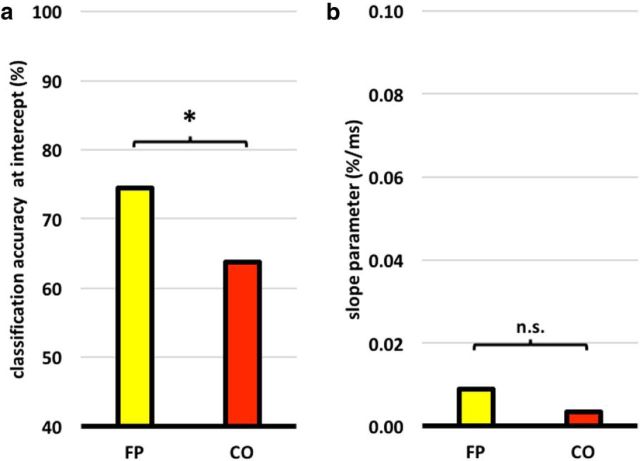
Figure 7.
Mean parameter estimates of α and β after regression of classification accuracy on absolute response time differences. a, Mean value of α across participants for each of the two subnetworks. α values for both subnetworks were significantly greater than chance (50%) at the p < 0.05 level. b, Mean value of β across participants for each of the two subnetworks. Neither was significantly greater than 0.

