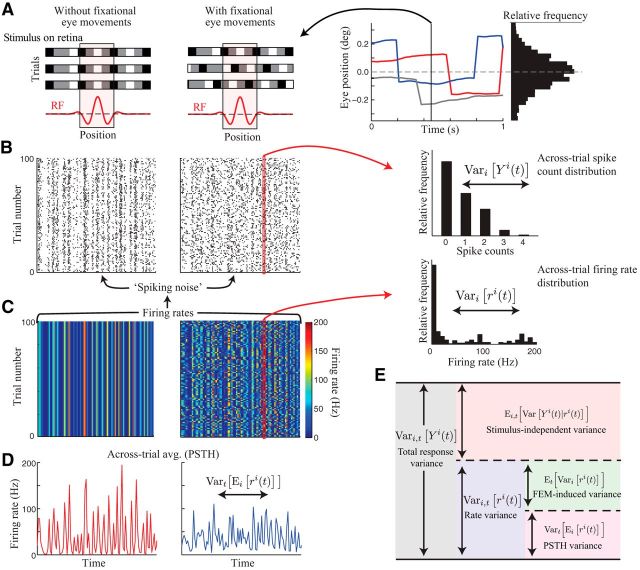
Figure 1.
Decomposing sources of neural response variability. A, Schematic illustration of a single frame of the visual stimulus, presented across multiple trials (different rows). The spatial profile of an example neuron's RF (red trace) is shown below. Without FEMs (left), the stimulus in the RF is identical across trials, whereas FEMs serve to “jitter” the position of the visual stimulus relative to the RF across trials. Example eye position trajectories across three trials are shown at right. B, Simulated spike rasters of a model neuron in response to repeated presentations of a “frozen noise” stimulus showing that FEMs produce increased trial-to-trial variability (right) compared with the neuron's response in the absence of eye movements (left). Inset at right shows the across-trial distribution of spike counts over the time window indicated by the red rectangle. C, Stimulus-driven firing rate on each trial from which the spiking data in B were generated (as a rate-modulated Poisson process). Note that this is by definition constant across trials in which FEMs are absent (left), although it exhibits substantial across-trial variability in the presence of eye movements (right). Inset at right shows the across-trial distribution of firing rates at the example time point (red rectangle). D, The across-trial average response (“PSTH”) is less variable across different time points of the stimulus in the presence of FEMs (right) because it averages together responses to different retinal stimuli in the neuron's RF. E, Schematic illustrating the decomposition of total spike count variance into its constituent components: stimulus-driven (blue region) and stimulus-independent (red) variance. The stimulus-driven variance is then further decomposed into FEM-induced across-trial variability (green) and across-time variability in the PSTH (magenta).

