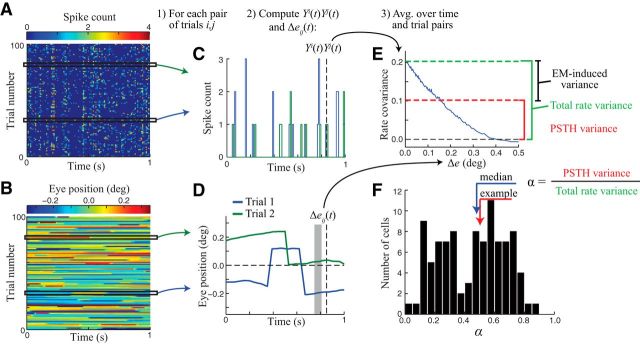
Figure 2.
Nonparametric estimation of eye-movement induced variability. A, Spike counts for an example neuron (in 10 ms time bins) across trials in response to repeated presentations of a frozen noise stimulus. B, Corresponding eye position data for each trial. C, Spiking responses are compared at each time point across all pairs of trials (shown for the example trial pair indicated by the black horizontal rectangles in A and B). D, Eye position trajectories for the same two example trials. The sequence of eye positions relevant for determining the neuron's response at a given time (vertical dashed line) is highlighted by the gray region (see Materials and Methods). E, Average product of spiking responses is computed across time points and trial pairs as a function of the similarity of eye trajectories Δe. In the limit as Δe goes to 0, this function provides an estimate of the firing rate variance (Eq. 8; green dashed line). The PSTH-based estimate of the neuron's stimulus-driven response variance (Eq. 6) is shown as the red dashed line for comparison. For this neuron, the fraction of firing rate variance captured by the PSTH (α) was 0.50. F, Across the population of neurons (n = 97), α values varied widely (median 0.48, interquartile range: 0.27–0.64).

