Figure 9.
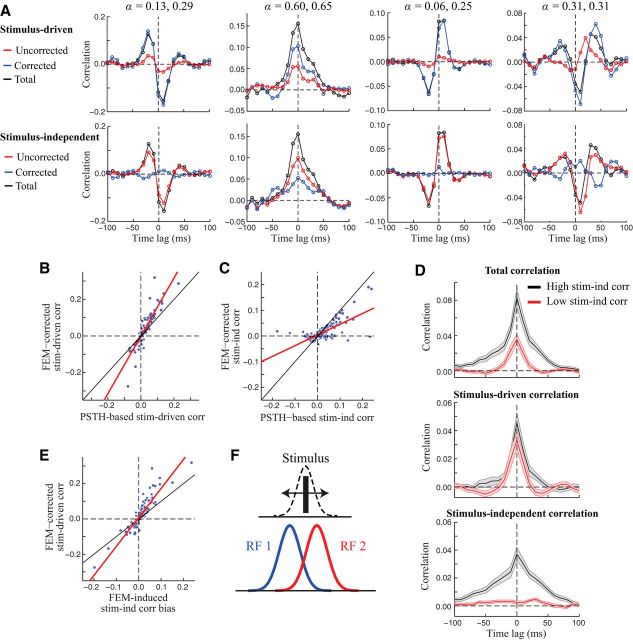
FEMs produce biased estimates of signal and noise correlations. A, Top, Raw cross-correlograms for four example neuron pairs (black), compared with FEM-corrected (blue) and PSTH-based (red) estimates of the stimulus-driven rate correlation. Bottom, Estimates of the stimulus-independent correlation with (blue) and without (red) correcting for FEMs are obtained by subtracting the stimulus-driven correlation from the total correlation (see Materials and Methods). In many cases, the uncorrected (PSTH-based) methods greatly underestimated the true firing rate comodulation, attributing it instead to correlated noise. α values for each neuron in the pair are listed above. B, Across all pairs of neurons (n = 256), FEM-corrected estimates of the stimulus-driven correlation (using the value at the time lag where the cross-correlogram amplitude was maximal) were approximately 1.6-fold larger than PSTH-based estimates (based on the slope of a linear fit; red line). Black line shows the diagonal. C, Correcting for FEMs reduced the magnitude of measured stimulus-independent correlations by more than half (slope of linear fit: 0.42). D, To illustrate the different timescales of stimulus-driven and stimulus-independent correlations, we performed a simple analysis in which we took neuron pairs with positive overall correlation and split them into two groups: those in which stimulus-independent correlations were large (black) and those in which they were small (red; see Materials and Methods). Both groups showed stimulus-driven correlations lasting several tens of ms (center), whereas stimulus-independent correlations remaining after correcting for FEMs (bottom) tended to occur on slower timescales. E, FEM-induced bias in estimates of the stimulus-independent correlation between a pair of neurons (i.e., the difference in corrected and uncorrected stimulus-independent correlation estimates) was strongly related to the (FEM-corrected) stimulus-driven correlation between the pair (slope of linear fit: 1.6). F, Schematic illustrating a simple scenario in which FEMs can introduce negatively correlated trial-to-trial variability between a pair of neurons with positive stimulus-driven correlation. The diagram shows the spatial profile of the RFs of two model neurons (red and blue curves). For a simple stimulus consisting of a single bar, FEMs will create trial-to-trial variability in the bar position relative to the neurons' RFs. Because the RFs are partially overlapping, this will produce negatively correlated variability, even though the overall “RF overlap” (and thus the overall stimulus-driven correlation) is still positive.

