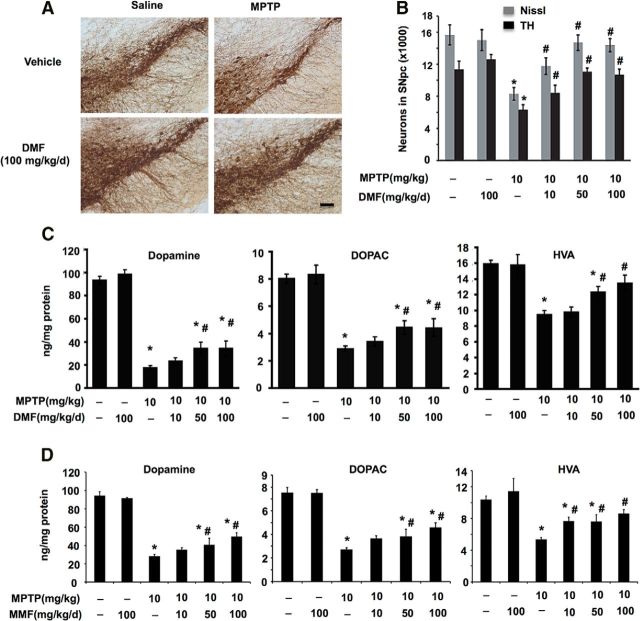
Figure 6.
Neuroprotective effects of DMF and MMF in the MPTP model of PD. Immunohistochemical staining for TH (A) and stereological analysis of total (Nissl) and TH+ neurons (B) in the SNpc in the acute MPTP model on day 7 after treatment with different doses of DMF (10, 50, and 100 mg · kg−1 · d−1, administered in 2 divided doses via oral gavage) for 6 d. Bars represent mean ± SEM. *p < 0.05 compared with saline controls; #p < 0.05 compared with MPTP (n = 6–10 mice per group). Striatal levels of DA and its metabolites DOPAC and HVA after DMF (C) or MMF (D) treatment as measured by HPLC-electrochemical detection analysis in the acute MPTP model on day 7. Bars represent mean ± SEM. *p < 0.05 compared with saline controls; #p < 0.05 compared with MPTP (n = 6–10 mice per group). Scale bar, 100 μm.

