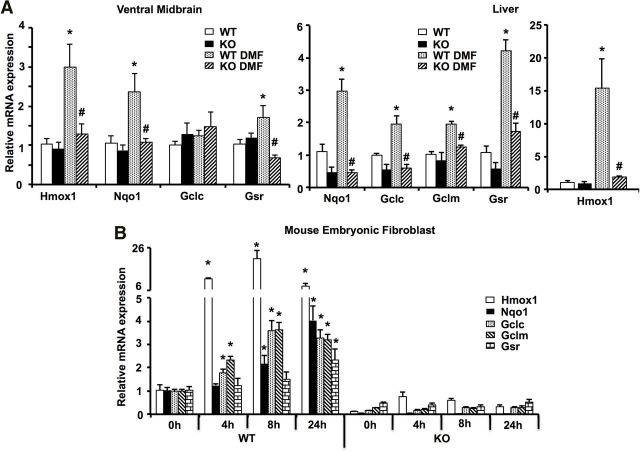
Figure 9.
Selective activation of the Nrf2 pathway by DMF. A, qRT-PCR analysis showing relative mRNA levels of ARE-containing genes in the liver and ventral midbrain of wild-type and Nrf2-KO mice 6 h after two doses of 50 mg/kg DMF administered by oral gavage 12 h apart. Bars represent fold expression of mRNA relative to β-actin values depicted as mean ± SEM. *p < 0.05 compared with respective controls of different ARE-containing genes; #p < 0.05 compared with the respective wild-type DMF treatment group (n = 5 mice per group). B, qRT-PCR analysis showing relative mRNA levels of ARE-containing genes in the wild-type and Nrf2-KO MEFs after treatment with DMF (20 μm) at different time points. Bars represent the mean ± SEM of relative mRNA levels (relative to β-actin). *p < 0.05 compared with 0 h respective controls (n = 3 per time point).

